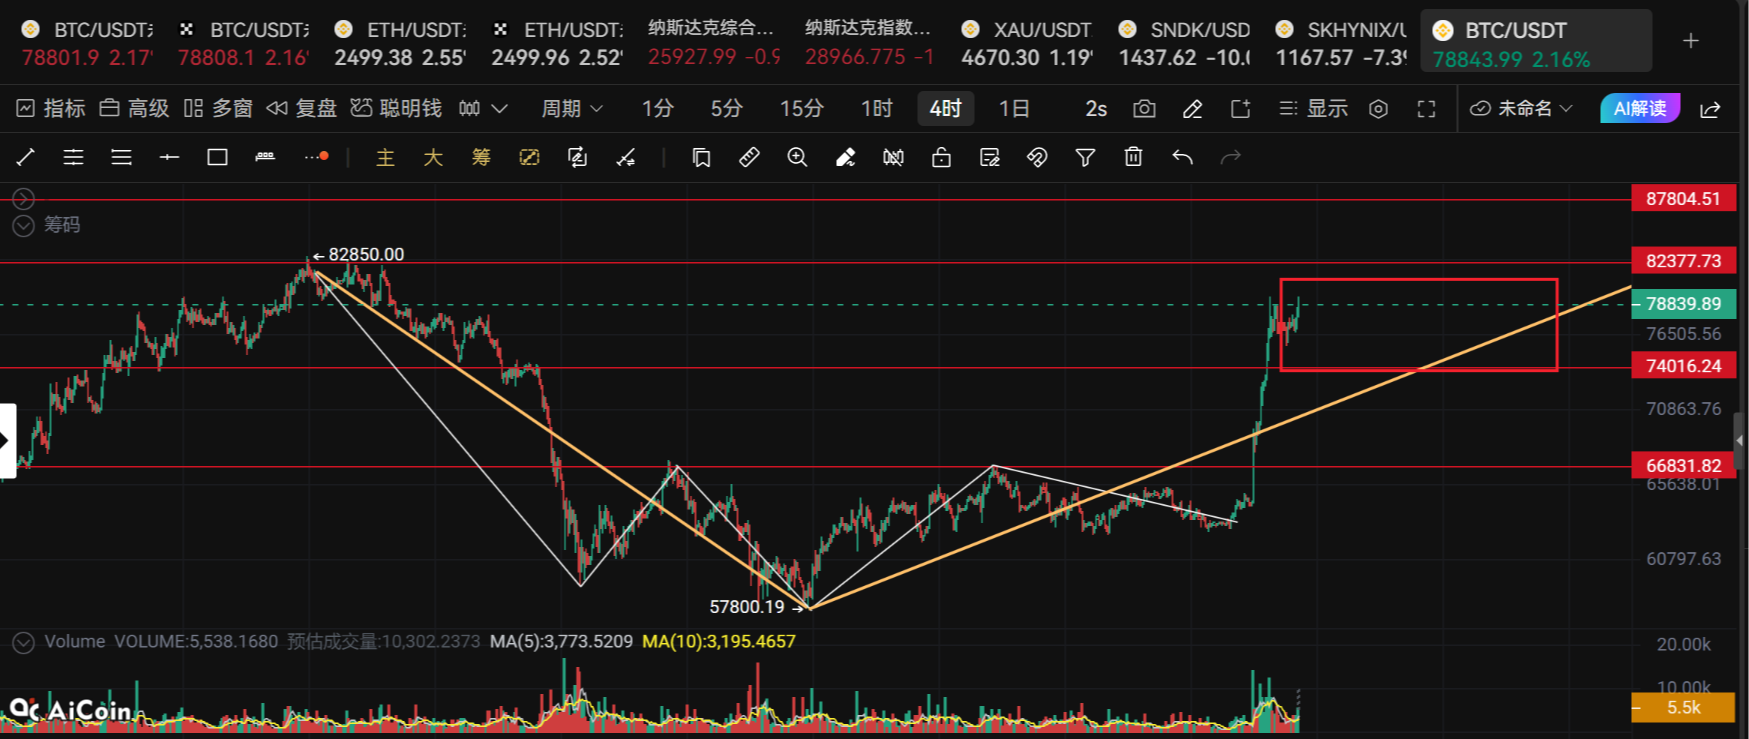
Crypto Circle Academician: The trend of Bitcoin (BTC) on August 25 has been rewritten. What are the cyclical signals behind BTC's surge? Latest market analysis and operational advice.
The current price of Bitcoin is 79200. I fear missing out and don't dare to short, yet I also fear buying at a peak and directly getting in at the mountaintop, feeling extremely conflicted internally. After a significant rise, there are two things to fear: first, impulsively chasing the rise, which leads to deep losses if a correction occurs; second, prematurely guessing the top and going short, being continuously swept away by the strong trend in the market. Market sentiment has been completely ignited, but during this accelerating upward phase, we cannot operate based solely on feelings; we need to rely on chart signals to make plans and not be confused by the market's explosive rise.
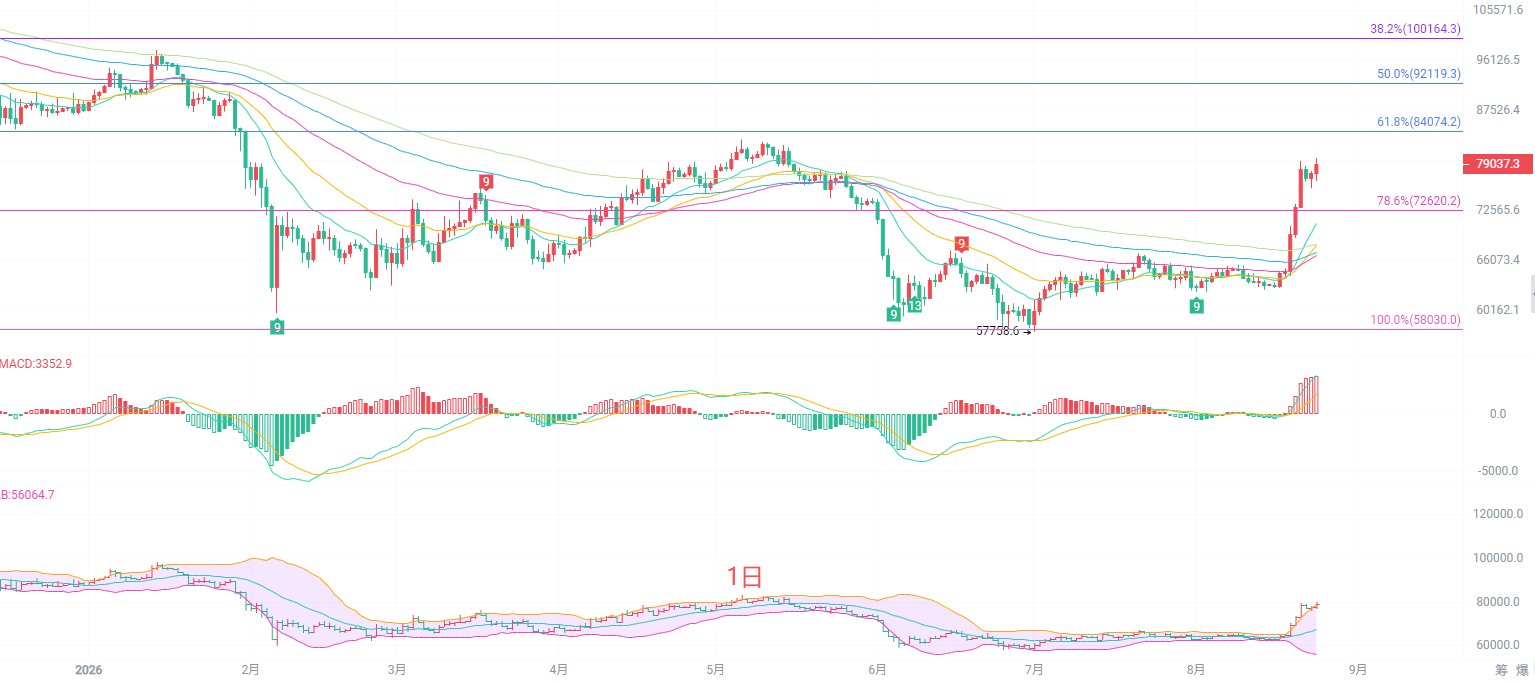
The daily candlestick chart shows a large bullish candle breaking through the previous fluctuating range, with the price above all EMA moving averages. All moving averages are turning upward, and the mid-term bullish trend has opened up. The Bollinger Bands are opening upward, with the price running outside the upper band, and the MACD histogram continues to expand, fully releasing the bullish momentum. The first resistance above looks at the Fibonacci 38.2% position of 100164, while the key support below rests at the 78.6% retracement level of 72620. However, it's important to note that after consecutive large rises, the indicators have entered the overbought zone, and there is a need for the daily chart to pull back and correct. The market won't always move in one direction upward; even if the big trend is bullish, it is not suitable for directly chasing the rise at high levels. Waiting for a pullback to confirm support will be a more prudent way to participate.
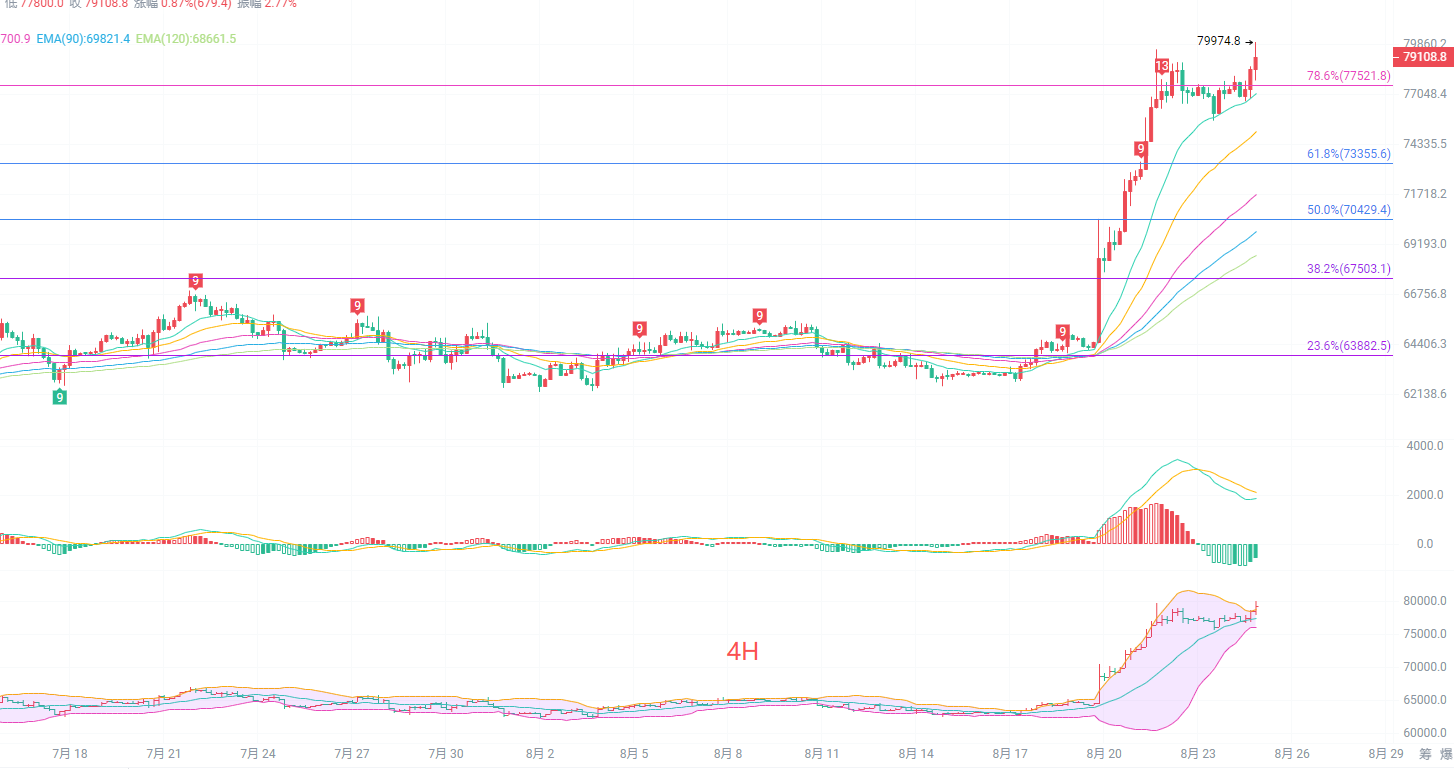
The four-hour candlestick chart shows a small retreat after reaching a high of 79974, with the current price at 79200. Short-term moving averages maintain a bullish arrangement, and the price is still operating near the upper Bollinger Band, but the MACD indicator has begun to show signs of a bearish divergence, with red bars continuing to shrink, indicating a short-term weakening of bullish power. The Fibonacci 78.6% position of 77521 has become an important short-term support. This wave of increase at the four-hour level is substantial, and there are large profit-taking positions accumulated in the short term, which could trigger profit-taking that brings a correction at any time. Although there are no immediate reversal signals for the main trend, it is not advisable to continue chasing highs in the short term. If the support holds, bullish momentum will continue, but if the key support is broken, a deep correction will begin.
Short-term reference:
Go long from 77500 to 77000, stop loss at 76200, target looking at 82000 to 85000.
Go short from 81000 to 81500, stop loss at 82600, target looking at 77500 to 74000.
Specific operations should be based on real-time market data. For more detailed information, you can consult the author. The article has a delay in publication; suggestions are for reference only, and risks are borne by the individual.

Warm Reminder: The above content is only created by the author's official account. The ads at the end of the article and in the comments section are unrelated to the author. Please identify them cautiously. Thank you for reading.
免责声明:本文章仅代表作者个人观点,不代表本平台的立场和观点。本文章仅供信息分享,不构成对任何人的任何投资建议。用户与作者之间的任何争议,与本平台无关。如网页中刊载的文章或图片涉及侵权,请提供相关的权利证明和身份证明发送邮件到support@aicoin.com,本平台相关工作人员将会进行核查。