To truly enter the RWA track, the biggest fear is that the data is scattered everywhere—on the issuer's official website, different blockchain explorers, and various third-party dashboards all providing conflicting information.
AiPlot's positioning is to centralize this key information: it specifically tracks 20 key RWA assets and presents the market structure according to
Asset|Type|Issuer|Asset Class|Networks|Value|APY|30d
this structure.
Overall Market Snapshot (Reference)
- The market capitalization of tokenized RWA is approximately $29B+ (excluding stablecoins)
- The dominant category remains tokenized US Treasury bonds/money market funds (Bonds / MMF)
- Precious metals and private credit closely follow
- Institutional issuers are highly concentrated: BlackRock (via Securitize), Circle, Ondo, Franklin Templeton, Tether, Paxos, Maple, Spiko, Centrifuge, etc.
Snapshot of 20 Key RWA Assets
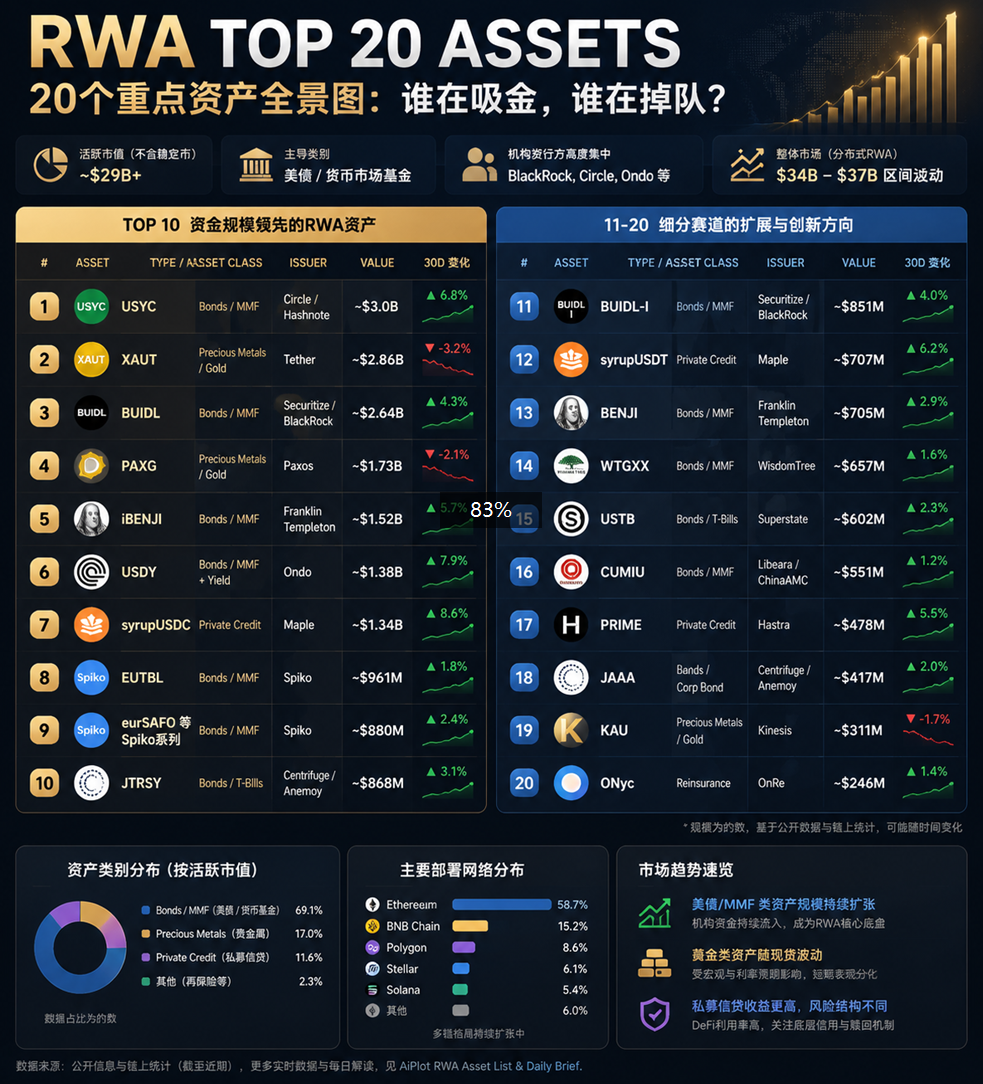
Who is increasing, who is decreasing (comprehensive recent trends):
- Relatively stable/scaling up: Tokenized US Treasury bonds and MMF types (USYC, BUIDL, USDY, Franklin series, Spiko, etc.). Institutional funds continue to flow in, leading in scale, with APY mostly in the short-term US Treasury yield range (about 3–5%, specific to market interest rate changes).
- Fluctuating with spot prices: Precious metals (XAUT, PAXG, KAU). Recently, when the spot price of gold weakened, these assets faced pressure.
- Higher yields but different risk and liquidity structures: Private credit (syrupUSDC, syrupUSDT, PRIME, etc.). DeFi utilization is higher, with APY usually surpassing pure government bonds, but attention should be paid to underlying credit quality and redemption mechanisms.
- Overall market: The distributed RWA value has recently fluctuated in the $34–37B range, with the number of holders still growing; Ethereum remains the primary deployment network, while BNB Chain, Solana, Stellar, etc., also hold significant shares.
Why do we need tools like AiPlot?
The table above can tell you who has a larger scale at a certain point in time, but it struggles to answer several critical questions that truly influence judgment:
- Is the change in scale due to new funds, or merely due to asset price fluctuations?
- Is a higher APY a market opportunity, or is it compensating for higher credit and liquidity risk?
- Who issues the same asset, on which networks is it deployed, and what changes have occurred in the last 7 days and 30 days?
Moreover, this information is usually scattered across issuer official websites, blockchain explorers, and different data platforms. With various update times and statistical standards, users often spend a lot of time looking up numbers, only to end up with several inconsistent snapshots.
AiPlot aims to solve not "just to create another RWA ranking," but to place assets, issuers, asset classes, deployment networks, values, APY, and 7/30-day changes into a single continuously updated view, supplemented by "daily summaries" to provide the market context of the day. You do not need to remember 20 numbers that will soon become outdated, but can continuously observe: who is expanding, who is falling behind, and what might be driving the changes.
These are just what AiPlot RWA Asset can tell you
Action Recommendations:
Directly open https://www.aiplot.com/, switch to the Chinese interface, log in, and check "RWA Asset List" and "Daily brief." This is your first stop for tracking "who is increasing, who is decreasing, who the issuers are."
For RWA, what is truly scarce is not data, but data that can be continuously compared, verified, and tracked. Open the AiPlot RWA asset page, first select a category from US Treasury bonds, gold, or private credit, compare the asset's value, yield, and 30-day changes, then return to the homepage to combine it with the "daily summary" to understand the market environment of the day.
Data will change, and tools will evolve.
Stay updated with AiPlot, Hong Kong's leading RWA data analysis tool, to clearly understand the market structure before taking action.
免责声明:本文章仅代表作者个人观点,不代表本平台的立场和观点。本文章仅供信息分享,不构成对任何人的任何投资建议。用户与作者之间的任何争议,与本平台无关。如网页中刊载的文章或图片涉及侵权,请提供相关的权利证明和身份证明发送邮件到support@aicoin.com,本平台相关工作人员将会进行核查。


