
Author: Jianwei Zhizhu Zatan
Citi Global Research released a report on commodity tail risk this month, with the core logic being: the traditional supply and demand analysis framework has become ineffective, and geopolitical, climate, and technological shocks have shifted from "once in a decade" to a normal phenomenon, requiring investors to pay attention to low probability, high destruction extreme scenarios.
Summary of key contents:
1) The U.S.-Iran conflict has evolved from a brief shock to years of damage to Gulf oil production capacity, resulting in crude oil prices rising above $150, and wholesale refined product prices exceeding $200, with U.S. retail gasoline prices consistently maintaining at $6 per gallon.
2) The escalation of the Russia-Ukraine conflict has led to renewed restrictions on oil and gas exports: this may be more significant for the global natural gas market than for the oil market.
3) Hoarding of critical minerals is intensifying: resulting in copper prices rising to $20,000 per ton or even higher.
4) Gold is expected to drop another 15-20% in the short term, after which prices may double.
5) Extreme El Niño phenomena and other severe weather: leading to soaring agricultural product prices, such as cocoa prices rising again above $10,000 per ton.
6) The boom and bust of artificial intelligence: benefiting electricity, natural gas, uranium, and electricity infrastructure-related metals like copper and aluminum on one hand, while also benefiting gold.
7) Trade wars again impact American farmers: the U.S.-China trade war has reignited, affecting American agricultural exports, possibly causing corn prices to drop below $4.2 per bushel and soybean prices below $10 per bushel.
8) As the Russian "Power of Siberia 2" gas pipeline transports gas to China, the liquefied natural gas surplus problem in 2030 will worsen, causing worldwide LNG prices like JKM to drop to $5-6 per million British thermal units.
9) "Extreme Monroeism": The U.S. blocks oil exports from all American countries, pushing global oil prices above $100 per barrel, while the U.S. benchmark oil price may be discounted by more than $30 per barrel.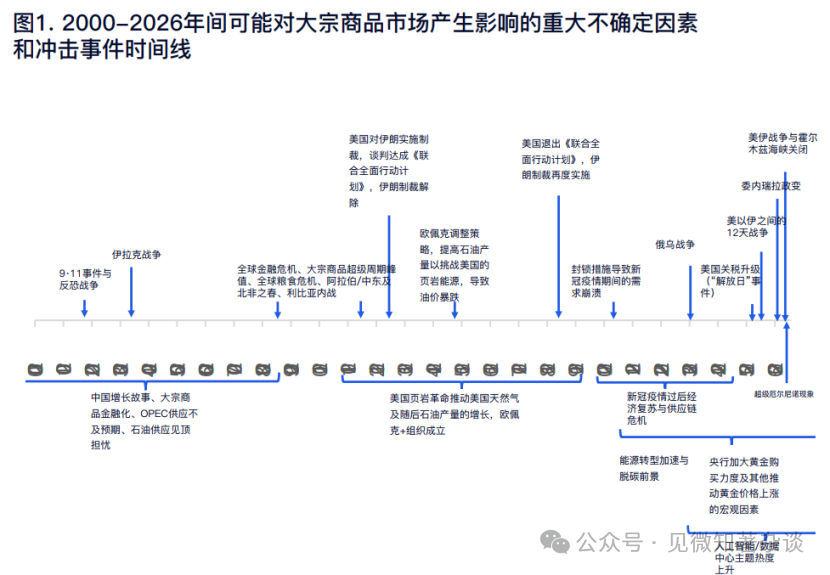
Potential Risks in the Second Half of 2026 - Replaying the 1970s Oil Crisis and Other Risk Factors
The pricing of commodities has entered an era where geopolitical, climate, and technological shocks frequently overwhelm traditional supply and demand analysis, with "once in a decade" events compressed to occur every 1-2 years; highly concentrated supply chains (Middle Eastern oil, Russian gas, essential minerals from China, Black Sea grain) make regional disruptions easily escalate into global price shocks. Government interventions have expanded from embargoes to sanctions, export controls, strategic stockpiling, and industrial policies, with policies from the Trump administration being an additional source of uncertainty.
After the return of geopolitics in the 2010s, new disturbances have emerged in the 2020s—super El Niño/La Niña impacts on agriculture, water, electricity, and transportation; on the technology side, AI and decarbonization lift long-term demand for copper and uranium while sowing the seeds for dual risks of an AI bubble burst. War, sanctions, climate, pandemics, and technological change have become core analytical items alongside supply and demand and inventories, and in the past twenty years, events like WTI negative prices, nickel breaking 100,000, and European gas prices soaring tenfold have all been driven by exceptional events rather than supply-demand imbalances.
Therefore, forecasts cannot just focus on benchmark scenarios; a set of "low probability, high impact, market not sufficiently priced" wildcards must be supplemented; this Citi report lists nine extreme scenarios for the second half of 2026 and beyond (long-term supply disruptions from the U.S.-Iran conflict, tightening natural gas supply in the Russia-Ukraine situation, mineral hoarding, gold prices first dropping then doubling, super El Niño, AI boom and bust, U.S.-China agricultural trade war, "Power of Siberia 2" collapsing LNG, and extreme Monroeism locking down American oil) to fill the existing bullish/bearish frameworks, reminding investors to conduct stress tests in the least prepared directions.
The above content is the author's note. Next, let's look at the specific scenarios.
1: The U.S.-Iran Conflict Evolves from a Short Shock to Years of Continuous Disruption of Oil Capacity in the Gulf Region
(Probability: Low | Impact: Extremely High)
How this scenario might be realized: If the conflict focuses and escalates to target Iranian public infrastructure (including power plants and power grids), or involves ground troop actions, one possible scenario is that Iran will respond by sabotaging the oil production infrastructure of oil-producing countries in the Gulf region.
This could lead to a long-term decline in Gulf production lasting several months or more, not to mention the export flow through the Strait of Hormuz. Another situation is that if the Strait of Hormuz remains closed throughout the first half of 2027 due to ongoing threats, the resulting loss of oil and gas supply would have similar consequences to the long-term shutdown of energy infrastructure, lasting 6-12 months or longer.
The U.S.-Iran conflict has already led to significant volatility in crude oil and petroleum product prices, affecting natural gas, metals, fertilizers, and other commodities impacted by the production conditions in the region and the export flow through the Strait of Hormuz.
From the "12-Day War" in June 2025 (U.S.-Israeli attacks on Iranian nuclear facilities) to the outbreak of conflict at the end of February 2026, followed by the signing of a memorandum of understanding in June 2026 and a fragile ceasefire, and military escalations appearing again in July 2026, we have observed oil and refined product prices first spiking, then retreating, and then spiking again.
However, so far, energy production infrastructure has not suffered sustained damage, so once the conflict ends, the supply should be able to recover, and depleted inventories can be replenished, returning the market to normal.
Our benchmark scenario suggests that neither the U.S. nor Iran wishes to cross the red line that would cause long-term damage to energy infrastructure—whether these facilities are located within Iran or in surrounding Gulf countries.
In contrast, this scenario would represent a significantly more extreme bullish case than before, and is only likely to occur if that red line is crossed, resulting in a significant decrease in production from Gulf oil-producing nations for several months or even years, or an equivalent scale of supply disruption triggered by a long-term blockade of the Strait of Hormuz.
Additionally, or concurrently, other relevant variables might come into play, including not just disruptions to the Strait of Hormuz, but also disruptions in the Bab el Mandeb Strait, while the U.S. might impose a ban on oil/petroleum product exports.
This could involve interruptions in the Red Sea route through the Bab el Mandeb Strait, as the Houthi armed group allied with Yemen and Iran is regrouping, having previously concluded a fragile ceasefire agreement with Saudi Arabia.
The concerned U.S. White House might impose restrictions on U.S. crude and/or petroleum product exports to suppress domestic oil prices, but this would lead to a spike in global oil prices.
Market Impact: If this does indeed happen due to misjudgment or other reasons, oil supplies could be disrupted for months or even years, and the resultant supply gap cannot be compensated by increased output from other areas; meanwhile, inventory depletion can only be sustained for a period of time, after which prices will rise parabolically, significantly repressing demand.
As we have previously demonstrated, with global oil inventories declining, for example, by measuring the number of days covered by demand, crude oil prices hit a high of $180-200 per barrel.
So far, while disruptions in the Strait of Hormuz occasionally result in supply losses of about 12-13 million barrels per day (leading to other market reactions to offset this impact, including an additional daily flow of about 5-6 million barrels from alternative routes, a decrease of about 4-5 million barrels per day in China's crude oil imports, and the International Energy Agency coordinating the release of around 1-2 million barrels per day from strategic oil reserves, as well as a daily demand destruction of 2-5 million barrels), the market has previously anticipated that this ultimately would be a V-shaped supply shock, as the global market was in a state of oversupply before this.
After the conflict ends, the market would quickly return to surplus, allowing for inventory replenishments.
If the daily supply of oil/liquid fuels continues to decrease by 5-10 million barrels (accounting for 5-10% of the total global supply), demand rationing similar to that during the COVID-19 lockdowns of 2020-22 would need to be implemented. With a simple estimate of oil demand price elasticity at -0.05, this would require related prices to rise by 100-200%, meaning a composite oil price exceeding $200 per barrel.
Even amid escalating tensions in mid-July 2026, Brent crude prices have already risen to about $88 per barrel, while the New York Mercantile Exchange diesel prices have exceeded $170 per barrel (equating to over $4 per gallon, not accounting for retail profits of about $1.4 per gallon, pushing retail diesel prices over $5.4 per gallon), and New York Mercantile Exchange gasoline prices have surpassed $140 per barrel (equating to over $3.3 per gallon, also not accounting for retail profits of $1 per gallon, thus retail gasoline prices are around $4.3 per gallon).
If wholesale gasoline and/or diesel prices reach above $200 per barrel, the retail price would be about $4.75 per gallon, and with retail profits, the national average diesel and gasoline prices could even exceed $6 per gallon.
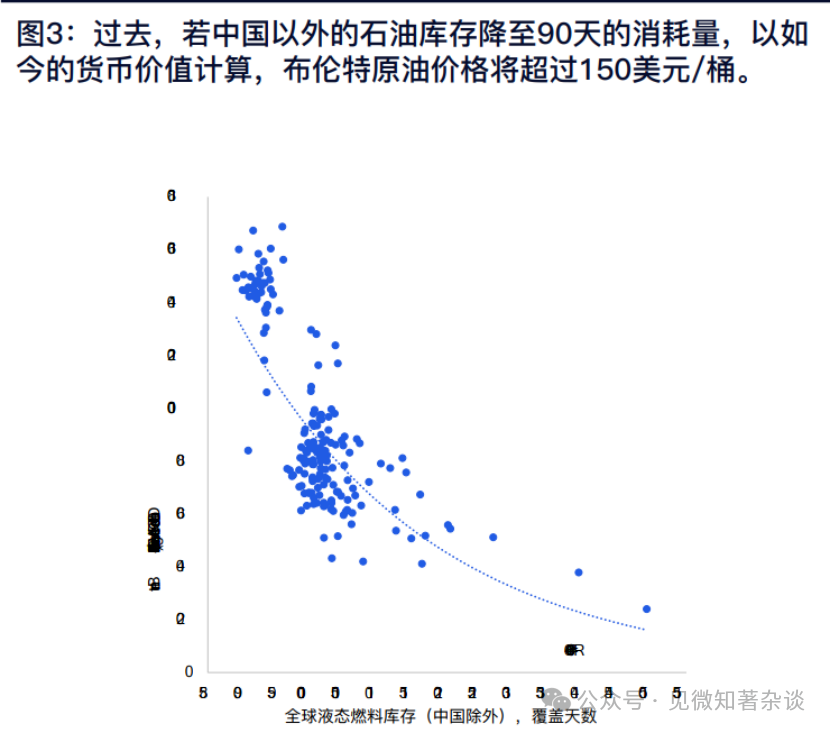
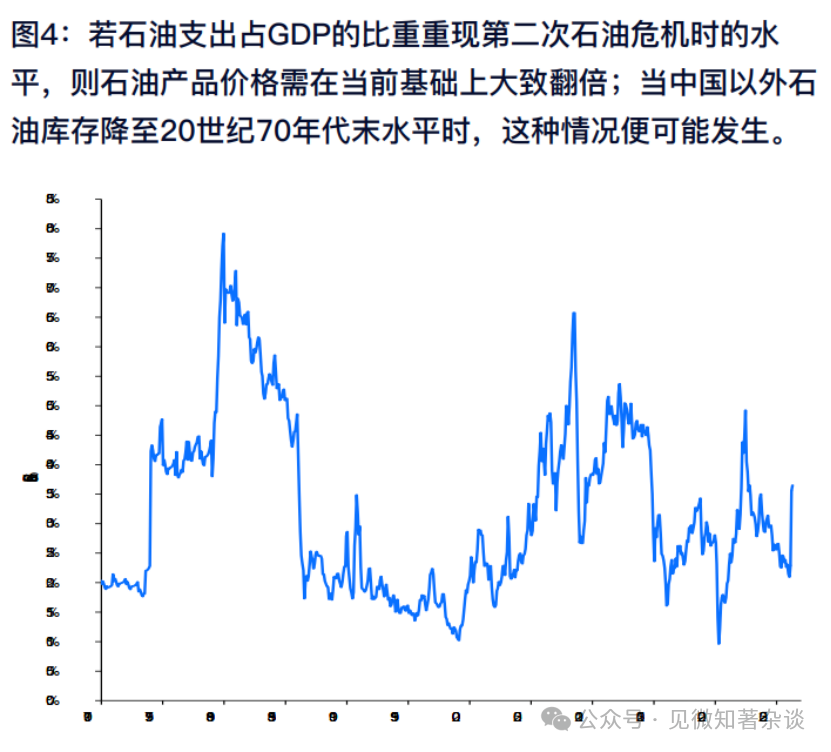
During the second oil crisis of the 1970s and 80s, oil inventories outside China fell to less than 70 days' worth of demand coverage, with oil spending skyrocketing to 8% of GDP; to reach the same level, composite oil prices would need to rise above $200 per barrel.
We previously predicted that if the Strait of Hormuz remains closed, leading to a global daily supply gap of 7-8 million barrels, and 80-90% of inventory depletion occurs outside China, then by early 2027, oil and product oil inventories outside China may drop to below 70 days of consumption—this level was last seen during the second oil crisis at the end of the 1970s to early 1980s.
If oil spending as a percentage of GDP reaches 8% again, this means that composite oil prices would have to double from current levels, exceeding $200 per barrel. As of July 2026, total oil inventories outside China could still maintain around 94 days of consumption.
However, compared to experiences in the 1970s, the following differences should be noted: at that time, strategic reserves were limited, and reports indicated that despite supply gaps, various parties were still building strategic reserves, thus reducing available commercial inventories and exacerbating supply tension.
This situation is unlikely to happen now as the OECD and China may use existing strategic reserves to buffer against shocks.
Additionally, the oil intensity of GDP growth is far lower than it was at that time. On the other hand, while total oil inventories remain relatively ample, refined oil inventories are at very low levels.
Even though crude oil inventories are at high levels, this may result in refined product prices being much higher than crude oil prices in recent periods.

Demand restriction measures help to reduce oil consumption, and the long-term energy transition processes may also accelerate, although the short-term economic damage may be substantial.
Refer to the International Energy Agency’s 2026 Energy Crisis Response Tracking report for various energy-saving and structural policies across countries. As energy transition and (fossil fuel) energy security goals increasingly align, this may indicate a long-term structural decline in oil demand.
Nonetheless, this will have little impact in mitigating the sustained high costs of oil in the short term, which will impose a heavy burden on the global economy.
2: Oil and Gas Export Restrictions from Russia Against the Background of Escalating the Russia-Ukraine Conflict
(Probability: Moderate | Impact: Varies—greater impact on natural gas and refined products than on oil)
The Russia-Ukraine conflict has persisted for more than four years and is likely to continue for several more months. With President Trump taking office, hopes for a negotiated resolution have increased, as the U.S. tries to become a key mediator between the two sides.
Although a negotiated settlement is still possible, hostilities continue, and there is still potential for imposing further restrictions on Russia's energy exports.
As a next possible measure to confront the Russian economy, we envision an unexpected scenario (wildcard scenario): existing Russian oil and gas exports face further restrictions, leading to global energy supply tensions, thereby putting upward pressure on energy prices again.
This would have a more significant impact on the natural gas market and refined oil than on crude oil.
Overall, strict restrictions could tighten the global crude oil market's daily supply by about 2 million barrels, which is less than 2% of the total global oil supply, but could result in nearly 7 billion cubic meters of annual gas shortages, which equates to about 8% of the global liquefied natural gas and European gas market total.
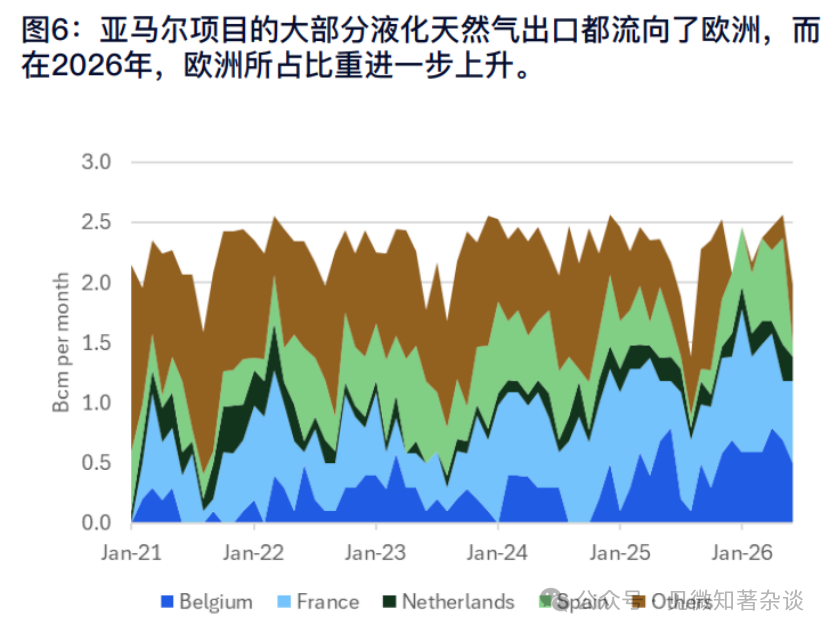
Regarding oil products, Ukraine's attacks on Russian refineries have already led to fuel shortages, forcing Russia to now import gasoline and announce a ban on diesel exports. These situations are similar to the consequences of banning the purchase of Russian oil products.
In 2025, Russia's diesel exports were approximately 800,000 barrels per day, but due to the inability to export, diesel's crack spreads have recently risen. The escalation of conflict impacts refined oil not by cutting exports again—since exports have already collapsed—but by exacerbating the already tense global market situation, especially as the Northern Hemisphere transitions into winter in a few months.
With low natural gas inventories being used for heating in Europe, and globally low diesel inventories as another type of heating oil, utilities and governments must take different measures to ensure supply, with global buyers competing to secure supply.
Some buyers concerned that diesel and natural gas supply shortages may last longer are likely to increase procurement volumes and even hoard supplies.
In terms of crude oil, the U.S. did not renew the exemption for purchasing Russian crude oil in mid-June, effectively leaving China as the only viable buyer, perhaps with India also involved. Although the U.S. has historically tightened related restrictions, certain entities in China continue to buy. According to shipping tracking data, India indeed reduced imports after the outbreak of the Russia-Ukraine conflict in 2022, from over 2 million barrels per day to lower levels, but has not completely gone to zero.
For pipeline gas and liquefied natural gas (LNG), the ban on Russian exports is likely to cause significant supply losses in the global market and trigger a sharp rise in TTF and JKM prices.
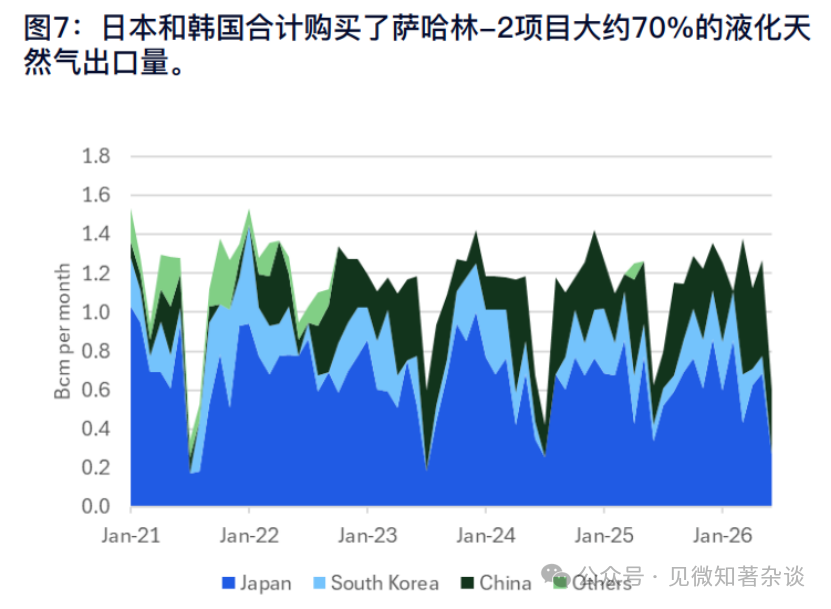
Specifically for LNG, Russia exported around 44 billion cubic meters in 2025, accounting for about 7% of global LNG supply, primarily from the Yamal LNG project and the Sakhalin-2 project. Europe accounted for about 75% of Yamal's exported volume, with France, Belgium, and Spain as the largest buyers.
So far in 2026, due to the closure of the Strait of Hormuz leading to disruptions in Middle Eastern supply, more Russian volumes are remaining in Europe rather than being re-exported, with Europe’s share rising to about 90%. In contrast, the Sakhalin-2 project primarily services Asian markets due to its geographic proximity, with Japan and South Korea together accounting for over 70% of its annual exports.
Therefore, if a global ban on purchasing Russian LNG is implemented, currently there needs to be a redirection or replacement of over 30 billion cubic meters of Russian supply sold outside China each year. China is likely to be the only major market willing and able to continue receiving Russian products.
However, considering shipping and logistics limitations, as well as the limited contract flexibility under existing long-term LNG contracts for Chinese buyers, it is unlikely that China will absorb all of the displaced volumes. The result will likely be a significant loss in global LNG supply, tightening the supply-demand balance and putting upward pressure on TTF/JKM prices.
For pipeline gas, the damage caused by import bans can be even more severe than those for liquefied natural gas imports, as the physical delivery restrictions make affected supplies nearly impossible to redirect to other markets.
Russia exports over 70 billion cubic meters of pipeline gas to markets outside China each year, including Europe, Turkey, and other former Soviet states.
In 2025, Europe and Turkey imported approximately 17 billion cubic meters and 20 billion cubic meters of pipeline gas, respectively. Replacing the combined annual supply of 37 billion cubic meters from these two markets would likely require a substantial increase in LNG imports, further tightening the global LNG supply-demand balance, increasing competition between European and Asian buyers, and pushing up spot prices.
3: Hoarding of Critical Minerals Drives Prices Higher, Such as Copper Exceeding $20,000/Ton
(Probability: High | Impact: Varies by Specific Commodities and Level of Hoarding)
If countries worldwide compete to build inventories and control the circulation and access of critical strategic minerals, prices will need to rise significantly to generate surpluses, support inventory accumulation, and incentivize potentially higher-cost capacity relocation back to domestic markets.
How this scenario might occur: Governments could significantly push for accumulating key mineral inventories in response to escalating geopolitical tensions or intensified competition in strategic industries, thereby pushing metal prices including copper higher.
In recent years, with increasing global geopolitical and trade tensions, and recognition of certain metals' critical roles in defense and emerging strategic industries like energy transition and artificial intelligence, policymakers’ concerns about mineral resource security have significantly risen.
For example, during the period from 2025 to early 2026, refined copper inventories shifted significantly towards the U.S., as markets worried about potential Section 232 tariffs on copper—that is based on efforts by the U.S. government to reduce dependency on critical mineral imports and incentivize domestic production.
Countries reliant on imports may seek to build inventories and relocate production back domestically, which could also tempt resource-rich exporting countries to restrict supply (or threaten to restrict supply) to extract maximum economic and political benefits, thereby further tightening global supplies.
Increasing metal production capacity takes years, while establishing domestic inventories can provide short-term buffers and has precedents. It is believed that China's National Reserve Bureau holds substantial strategic copper inventory, though specifics are unclear.
In the early 1960s, the U.S. held a strategic copper reserve amounting to about 10 months of its domestic consumption, exceeding 900,000 tons. Investors and supply chain participants may also act independently of government actions to build inventories or independently seek physical asset exposure. If the market starts to anticipate large-scale strategic procurement actions, this will amplify both the scale and speed of inventory accumulation.
If the government begins to accumulate critical materials, original equipment manufacturers, producers, and financial investors may follow suit either earlier or later, aiming to ensure stable supply, hedge against industrial policy fluctuations, or allocate physical assets in an increasingly uncertain macroeconomic environment.
We have already seen various governments take measures to accumulate strategic commodity inventories. This includes the U.S. "Project Vault" plan (which proposes $12 billion for accumulation of critical industrial commodities); the EU announcing €3 billion for securing critical mineral supplies; and a trade association in China calling for increased copper reserves via the national reserve system.
For the moment, the funds already invested by the U.S. and EU may have some impact on smaller-scale markets like rare earths, but it is less likely to lead to significant changes in markets like copper.
Market Impact: This extreme scenario envisions that, as decision-makers' focus on resource security issues deepens, more funds will be allocated to global stockpiling plans and raw material inventory accumulation. The following illustrates how this situation can significantly increase prices for such minerals, using copper as an example.
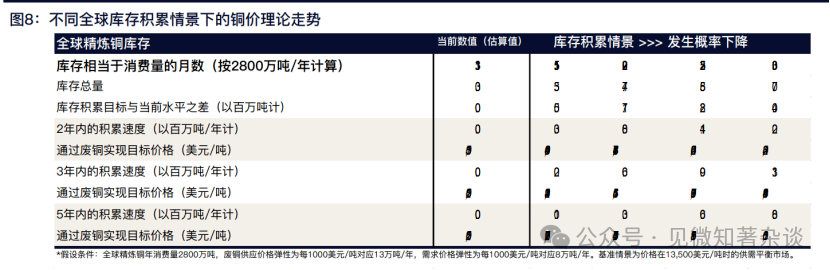
We assume that current global refined copper inventories are around 3 million tons (with a wide margin of error, including China’s national reserve stocks), equivalent to approximately 1.3 months of global consumption. To raise global copper inventories to the equivalent of three months of consumption, the world needs to accumulate an additional 4 million tons of copper stock, which if completed over two years would mean about 2 million tons per year.
The short-term spot market price elasticity for copper primarily derives from scrap supply, followed by the extent of demand substitution and conservation. Historical elasticity data suggests that to produce the incremental supply needed for new inventories, copper prices could need to reach around $23,000 per ton.
4: Gold Prices May Drop Another 15-20% in the Short Term, Then Potentially Double
(Probability: Low | Impact: Low)
Gold prices surged strongly from $2,500 per ounce in January 2025 to $5,500 per ounce by February 2026, then retreated to around $4,000 per ounce currently.
Given that the value of gold reserves accumulated over thousands of years has increased by 60% in the past year, investor positions are at a loss, and physical demand in regions outside China remains weak, gold prices may have further downside potential in the near term.
However, in the long term, due to China’s massive trade surplus (over $1.3 trillion excluding gold), the Central Bank of China's gold purchasing actions, increasingly severe global fiscal sustainability issues and related currency depreciation concerns, along with high levels of global geopolitical tension, the outlook for the gold market remains highly optimistic.
We believe that a substantial amount of funds may be allocated to gold for the reasons mentioned above, and given that the gold market is relatively small, prices are expected to rise to around $6,000 in the next few years.
We suggest that downward risks are greatest in the near term. Seasonal factors will improve in September and October, thus the window for a substantial decline in prices is within the next 4-6 weeks.
Several factors could lead to significant declines in gold prices: if China stops purchasing gold within the next month, holders (central banks or ultra-high net worth individuals for liquidity purposes) sell off during stock or bond market pullbacks, a sharp deterioration in the situation in the Strait of Hormuz/Middle East pushes up real interest rates and the dollar exchange rate, exacerbating some or all of the above issues.
If prices fall below about $3,800, ETFs and other leveraged positions could create massive selling pressure. Aside from China, there is almost no physical demand to support at the current price levels.
Subsequently, with inflation significantly easing and spurred by another wave of gold purchasing by investors, gold prices may rise to $6,000, nearly doubling, with various catalysts at play.
5: Extreme Weather May Intensify, with Potential for Record-Strong El Niño Phenomena, Impacting Agricultural Commodities
(Probability: Moderate | Impact: High)
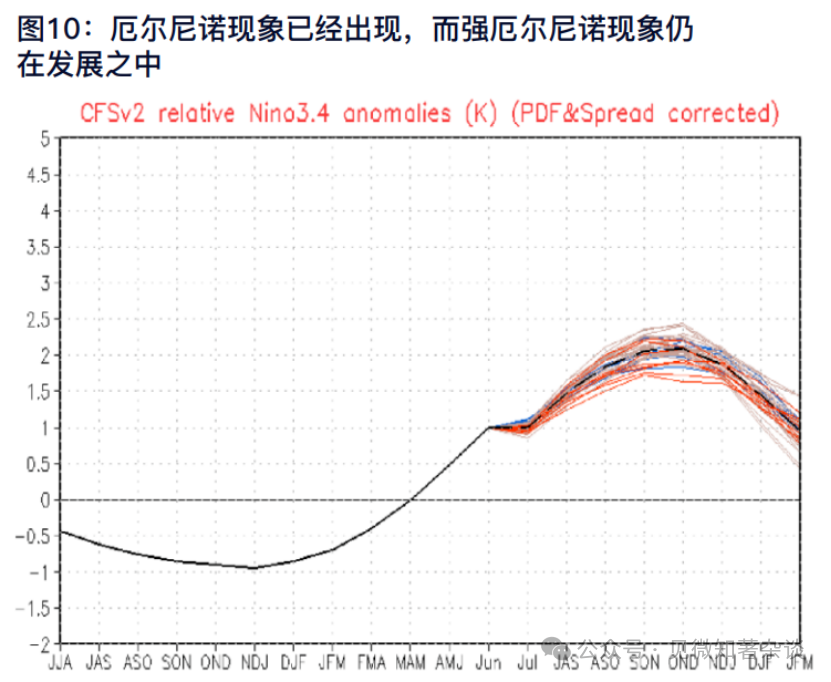
Moderate to strong El Niño events themselves are not unexpected variables and have been incorporated into our baseline price outlook.
However, if a potentially record-strong El Niño arises, the severity and duration of the adverse weather conditions it brings could still lead to significant disruptions in the supply of key agricultural commodities and sharp increases in prices, thus posing important upside risks scenarios.
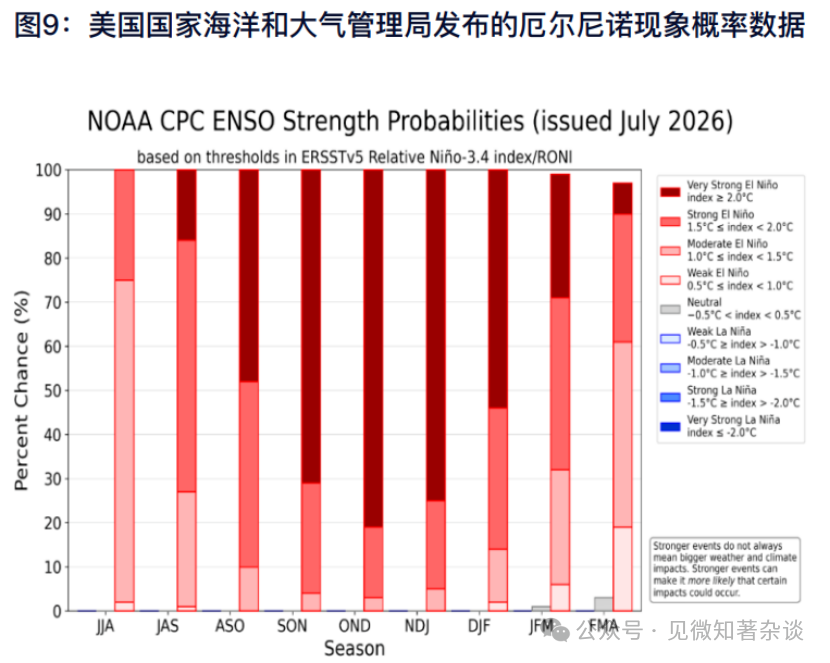
In the latest update in July, NOAA raised the probability of a super El Niño event to 81%, with a 97% chance that conditions will persist until spring 2027.
Historically, major El Niño events occurred in 1982-83, 1997-98, and 2015-16, while weaker El Niño events happen more frequently and usually cause less destruction. This phenomenon typically peaks during the winter months in the Northern Hemisphere.
While any commodity price outlook based on weather patterns beyond a 14-day forecast period is inherently uncertain, the overall geographical distribution pattern of weather anomalies typically associated with a classic El Niño is relatively clear. Forecasters can usually identify which regions may experience precipitation above or below normal levels.
However, the severity, persistence, and ultimate impact of these weather anomalies on crop production are far more difficult to predict. Moreover, during super El Niño events, the occurrence probability and intensity of such weather disruptions increase significantly, raising the risk of substantial losses in agricultural production and exacerbated price volatility.
El Niño phenomena affect various agricultural commodities differently, leading us to be bullish on the price outlook for these commodities. Cocoa, sugar, and coffee (with Robusta coffee being more affected than Arabica coffee) production are significantly influenced by such weather conditions.
From the perspective of the Chicago Board of Trade (CBOT), soybeans may be more affected, while corn and wheat are relatively less impacted.
El Niño typically benefits crop yields in the U.S. but reduces yields in Australia, Russia, Ukraine, and Kazakhstan. During El Niño events, the warming of the Pacific waters transports substantial heat into the atmosphere. This disrupts normal atmospheric circulation patterns, triggering a chain of weather changes globally.
The most common manifestations of these changes include: drought (in regions with typically stable rainfall, such as Southeast Asia, Australia, and parts of Africa and India); increased rainfall and flooding (in the Americas, especially the west coasts of South America and Central America, and the southern U.S.); and higher winter temperatures (in the northern U.S. and Canada).
These temperature and precipitation changes may severely impact various agricultural commodities, particularly soft commodities, as well as grains. Recent heatwaves in Europe have triggered serious concerns about local corn yields, while reduced rainfall during India's monsoon may cut sugar, soybean, and corn production.
If similar weather phenomena as the Hamaadan wind of the 2023-24 planting season strike West Africa again during the current El Niño cycle, cocoa supplies could be severely disrupted, with prices likely rising to $10,000 per ton or even higher.
Additionally, strong El Niño events are often associated with above-normal rainfall in Ecuador, increasing the risk of flooding.
If potential record El Niño intensities lead to repeated or worsening floods, Ecuador's cocoa production may fall by 100-200 thousand tons, which would be a heavy blow to the already fragile global cocoa market.
Simultaneously, low rainfall in June in India, combined with potential rainfall shortages in the next three to six months in India and Thailand, brings significant upward risks for sugar prices. If excessive rainfall and flooding in Brazil disrupt harvesting activities and force sugar mills to temporarily halt production, supply could tighten further.
As El Niño conditions strengthen, the likelihood of these weather-related disruptions increases, potentially pushing global sugar prices up to around 25 cents per pound.
We also expect that average global temperatures will rise, but how much and for how long are important variables; this is critical not only for natural gas prices but also for agricultural yields.
In El Niño years, higher-than-average temperatures and lower-than-normal rainfall can significantly reduce crop yields due to aggravated heat and moisture stress. During crucial growth periods like flowering and grain filling, excessively high temperatures can damage crops, leading to poor pollination, and stunted pod and seed development, resulting in reduced overall productivity.
Combined with drought conditions, high temperatures can also cause leaf scorch, wilting, and accelerated maturation of crops, limiting accumulation of grains, sugars, or biomass.
Crops particularly vulnerable to these conditions include rice, corn, sugarcane, soybeans, cotton, and cocoa, and in severe cases coffee can also be affected, although the degree of impact varies based on the region and timing of heat stress occurrence.
6: AI Turning Point: Boom or Bust? Creates Bidirectional Risks for Commodities
(Probability: Low to Moderate | Impact: High, but different commodities are affected to varying degrees)
Currently, the trajectory of artificial intelligence development brings highly asymmetric bidirectional risks to the commodities market. If the "AI bubble" bursts, it may trigger global risk-averse sentiment and deflationary demand shocks, negatively impacting commodity demand prices.
Conversely, if AI can bring about productivity booms early on, the sustained growth in demand for AI-related commodities (such as electricity and industrial metals) would bring favorable tailwinds. The deflationary effects of global productivity improvement might negatively impact non-AI-related commodity demand, but the resultant loose monetary policies could offset this effect.
Development Path under Prosperity Scenario: AI-driven productivity improvement will manifest in corporate performance, actual GDP growth, and positive macro data surprises, thereby supporting accelerating expansion of AI infrastructure. In the late 1990s, as IT applications crossed critical thresholds, U.S. non-farm business productivity jumped from about 1.5% annual growth to over 3% within a few years.
If we see a similar AI-driven acceleration today, this could constitute a significant positive supply-side shock to the global economy.
Development Path under Bust Scenario: Investors may feel disappointed by the timeline for AI monetization, leading to significant corrections in tech stock valuations. Evi<|endoftext|>
免责声明:本文章仅代表作者个人观点,不代表本平台的立场和观点。本文章仅供信息分享,不构成对任何人的任何投资建议。用户与作者之间的任何争议,与本平台无关。如网页中刊载的文章或图片涉及侵权,请提供相关的权利证明和身份证明发送邮件到support@aicoin.com,本平台相关工作人员将会进行核查。


