Good evening, teammates, I am Sister Qinglan.
Tonight's market is destined to be tumultuous. The U.S. debt is nearing 40 trillion dollars, and this number hangs over us like the sword of Damocles, with the demand for Bitcoin and gold as safe havens warming up. On the other hand, the Federal Reserve may maintain high interest rates this week and even consider raising rates, which is a blow to risk assets. With both upward and downward forces, Bitcoin is repeatedly wavering around 65,000, is it a safe haven for risk-averse funds or a trap under high interest rates? Let's dive straight into the data.
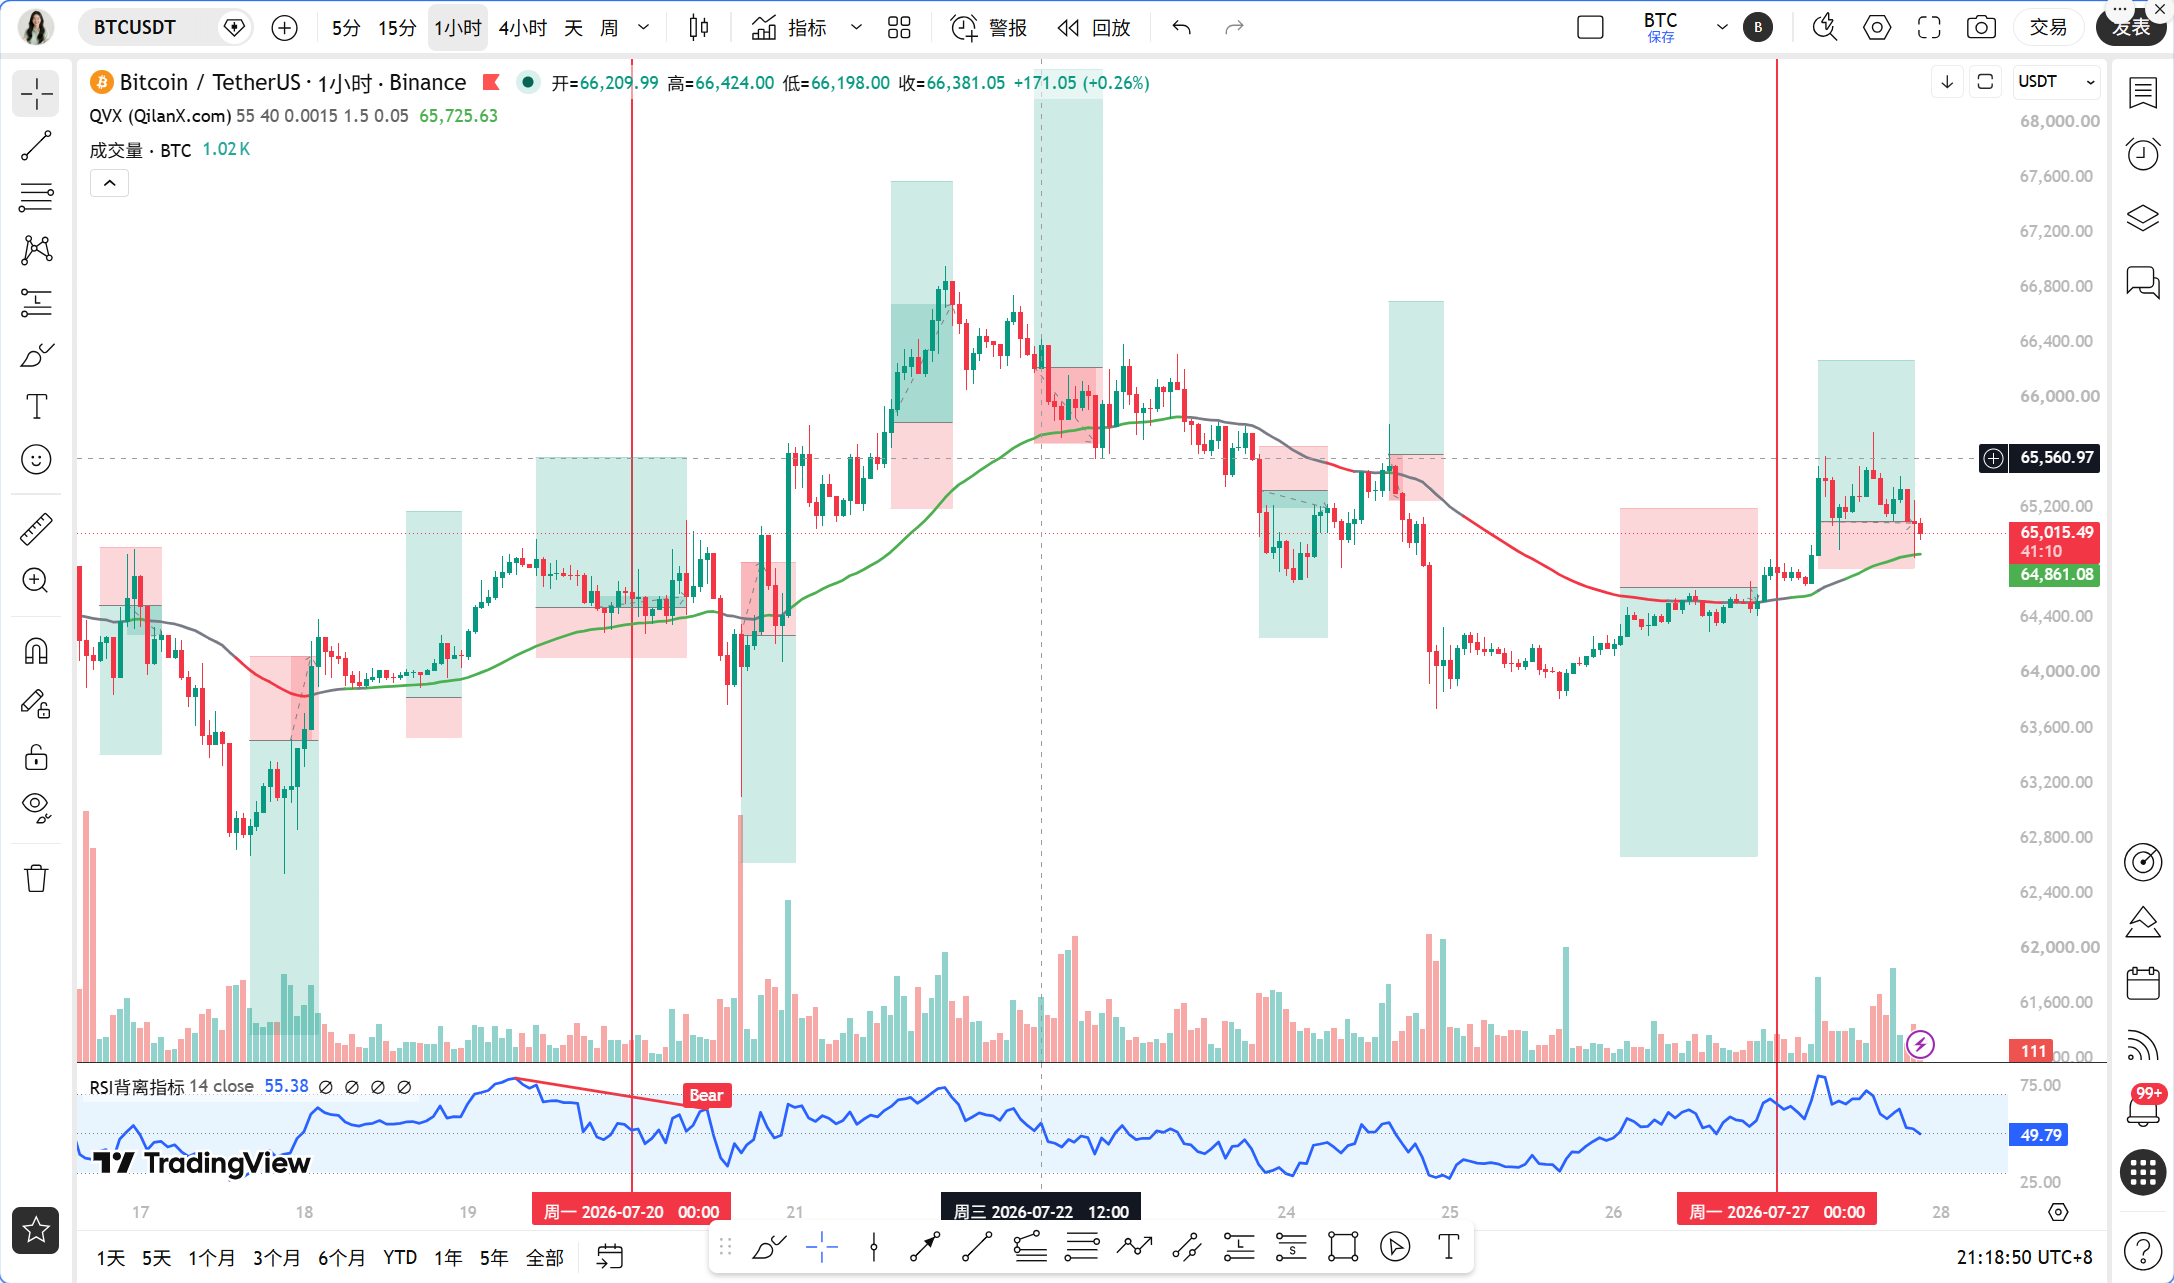
Current time: July 27, 21:18, with the Bitcoin price at 65,015 USDT. This position is very delicate, neither up nor down, with both bulls and bears waiting for a clear signal.
Let's first look at the multi-period status. On the daily chart, MA5 is at 64,805, MA10 is at 65,151, and the price is exactly between the two moving averages. The MACD histogram is positive but the momentum is not strong; the RSI is at 62.26, which is neutral to slightly strong but has not entered the overbought zone. On the 4-hour chart, MA5 crosses above MA30, indicating a bullish arrangement of short-term moving averages; the MACD histogram is at 106.82, showing that rebound momentum is still present, but the RSI has reached 71.75, near overbought, indicating significant short-term gains and a need for a pullback. On the 1-hour chart, the price is operating below MA5 and MA10, the MACD histogram has turned negative, and the RSI is only at 36.91, indicating weak short-term momentum. On the 15-minute chart, the price has fallen below all short-term moving averages, and both MACD and RSI are in weak areas, giving an advantage to short sellers.
Overall, the daily and 4-hour charts are bullish, but the 1-hour and 15-minute charts are bearish, indicating a divergence in various timeframes, which is likely to result in sharp turbulence.
Next, we will use the Qinglan TPV system to verify the signal. The core rule is the 1-hour EMA55, which is currently at 64,862.21. Over the last 8 hourly candlesticks, the closing price has been above EMA55, with a cross count of 0, which according to the rules, falls into a unilateral bullish trend. However, note that the absolute difference between the current price and EMA55 is only 0.24%, which is below the 0.3% threshold, indicating close-line fluctuations and an increased probability of turbulence. Thus, although the trend is defined as bullish, the price is very close to the moving average and could change direction at any time.
For long positions, the condition that the price closes above EMA55 for 2 consecutive hourly candlesticks is met. However, the conditions for support stabilization and the exhaustion of downward momentum are currently not apparent. The 1-hour MACD histogram has been continuously shortening, but there has been no formation of a bottom pattern or long lower shadow for stabilization, and the RSI is still at 36.91, having not rebounded from the oversold area. Therefore, the long signal is not strong.
For short positions, the condition that the price presses below EMA55 is not satisfied, as the current price is still above EMA55. Thus, the short signal also does not hold.
In summary, the TPV system indicates that the trend is slightly bullish, but the price is at the line, belonging to a bullish oscillation pattern. It is advisable not to actively chase longs and not to blindly short, instead wait for a clearer signal.
Now let's look at on-chain data and capital flow. The fear and greed index is only 30, which is in the fear zone, indicating that market sentiment is not optimistic and retail investors are still in panic. BTC has increased by 0.85% in 24 hours, with a market share of 56.4%, showing little change. In the focus news, Strategy has not increased its Bitcoin holdings for three weeks, and U.S. dollar reserves have surged by 1.2 billion, which is a negative for short-term demand. However, Bitcoin ETFs have seen inflows for three consecutive weeks, indicating a recovery in institutional demand, though the growth rate has slowed. Meanwhile, Binance has counterintuitively attracted 36.9 million dollars, while other exchanges have seen a net outflow of nearly 1 billion, demonstrating that funds are concentrating on leading platforms, resulting in a tighter overall capital situation. Circle has increased the supply of 250 million USDC on the Solana chain, enhancing liquidity, which is a positive development. Whales have also been making large purchases of ETH, exceeding 50 million dollars, indicating bullish sentiment among institutions.
In conclusion, the capital situation is intertwined with both bullish and bearish elements; ETF inflows and stablecoin issuance are supportive, but corporations halting increases and exchange differentiation are worrisome.
The key attack and defense levels are the resistance zone at 65,500 to 66,000, which are previous highs and resistance levels for smaller cycles. The support zone is at 64,800 to 64,500, corresponding to the 1-hour EMA55 and the daily MA5. If it falls below 64,500, the next support is around 64,000.
In terms of trading strategy, Sister Qinglan proposes the following:
Direction: Bullish oscillation, but do not chase high; wait for a pullback to buy.
Entry condition: If the price retraces to the 64,800 to 64,500 zone and shows a stabilization signal such as a bottom pattern or long lower shadow on the hourly chart, while the MACD histogram starts to shorten and the RSI rebounds from a low level, a small position can be tried for a long.
Stop loss: Set below 64,300. If it breaks down, it indicates that support is ineffective, and you need to exit.
Target: First target at 65,500, second target at 66,000. If the price breaks through 66,000 with volume, you can continue to hold for a higher target.
If the price directly surges to the 65,500 to 66,000 zone and shows a topping pattern or long upper shadow on the hourly chart, while the MACD histogram starts to shorten and the RSI retreats from a high level, a small position can be tried for a short.
Stop loss: Set above 66,200.
Target: First target at 65,000, second target at 64,500.
Risk warning: Current multi-period divergence, price near the line, high probability of turbulence; keep positions light, strictly enforce stop losses, and do not hold positions.
Follow Qinglan Crypto Classroom to grasp more trading opportunities! Welcome to visit the official website www.qinglan.org
📊 Qinglan TPV Trading Strategy Backtest Reference
🕒 Last Backtest Time 07-27 07:00:01
Total Analysis: 3235 Backtest: 2444 Accuracy Rate: 77.5% (1893/2444)
免责声明:本文章仅代表作者个人观点,不代表本平台的立场和观点。本文章仅供信息分享,不构成对任何人的任何投资建议。用户与作者之间的任何争议,与本平台无关。如网页中刊载的文章或图片涉及侵权,请提供相关的权利证明和身份证明发送邮件到support@aicoin.com,本平台相关工作人员将会进行核查。


