Li Ying Chat Coin: 7.24 Bitcoin (BTC) and Ethereum (ETH) Latest Market Analysis
Currently, Bitcoin is at 64800. Looking at the K-line chart with alternating red and green bars, and several moving averages entangled together, the current signals from the technical indicators lean towards bearish, but there is support. First, looking at the moving average system, EMA7 has crossed below EMA30, forming a short-term death cross which indicates a heavy short-term selling pressure. However, the purple EMA120 is right in front, which is the lifeline for the medium to long-term. The current price has precisely returned to this level, which is a key defense point. The MACD indicator is still in an adjustment cycle overall, meaning the downward momentum has not yet fully released. The price has reached the lower bound near 64900, which usually leads to a rebound demand when hitting the lower bound, but the opening is expanding downwards, so one must be cautious of unilateral downward risks.
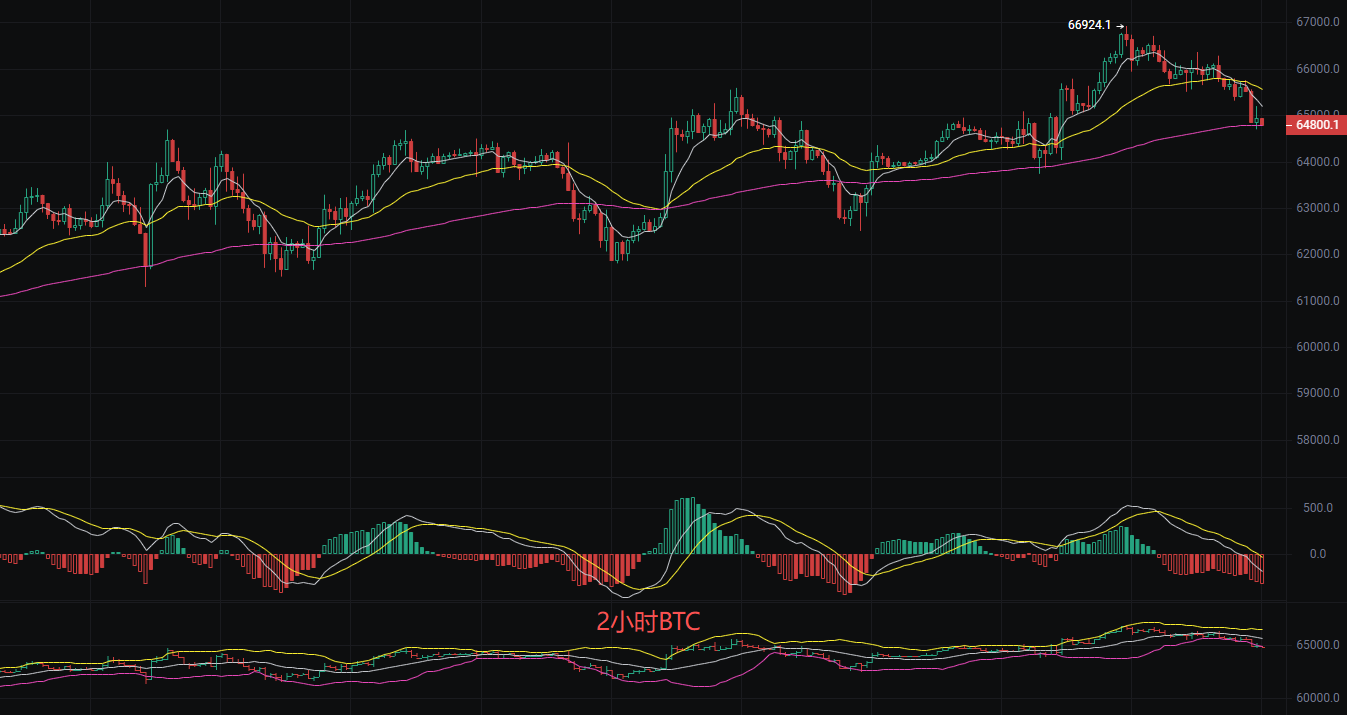
Short-term Trading Ideas:
Sell at points 64800-64300, stop loss at 63900, target 65500 aiming at 66500
Sell at points 67000-67500, stop loss at 68000, target 66500 aiming at 66000
Ethereum
Everyone, before the Ethereum report, it was at 1890. Simply put, it surged too much before, and now it's kind of stuck in price, currently retracing to find support. What everyone is most concerned about is: is this just a normal rest during the upward trend, or is it a trend reversal leading to a big decline? Currently, although the short-term is dropping, the larger direction has not completely turned bad; it's just that the bulls have temporarily caught their breath. The moving averages have formed a short-term death cross, suppressing the price firmly below 1905, indicating that the short-term bearish strength is dominant. However, the lower EMA120 still maintains a divergence upwards, which is the last line of defense for the medium-term bull market. The MACD indicator continues to decline, indicating that the adjustment is not yet over. The Bollinger Bands are tightening downwards, and the price is running closely along the lower bound at 1892. If it effectively breaks below the lower bound, it may trigger an accelerated decline testing lower supports.
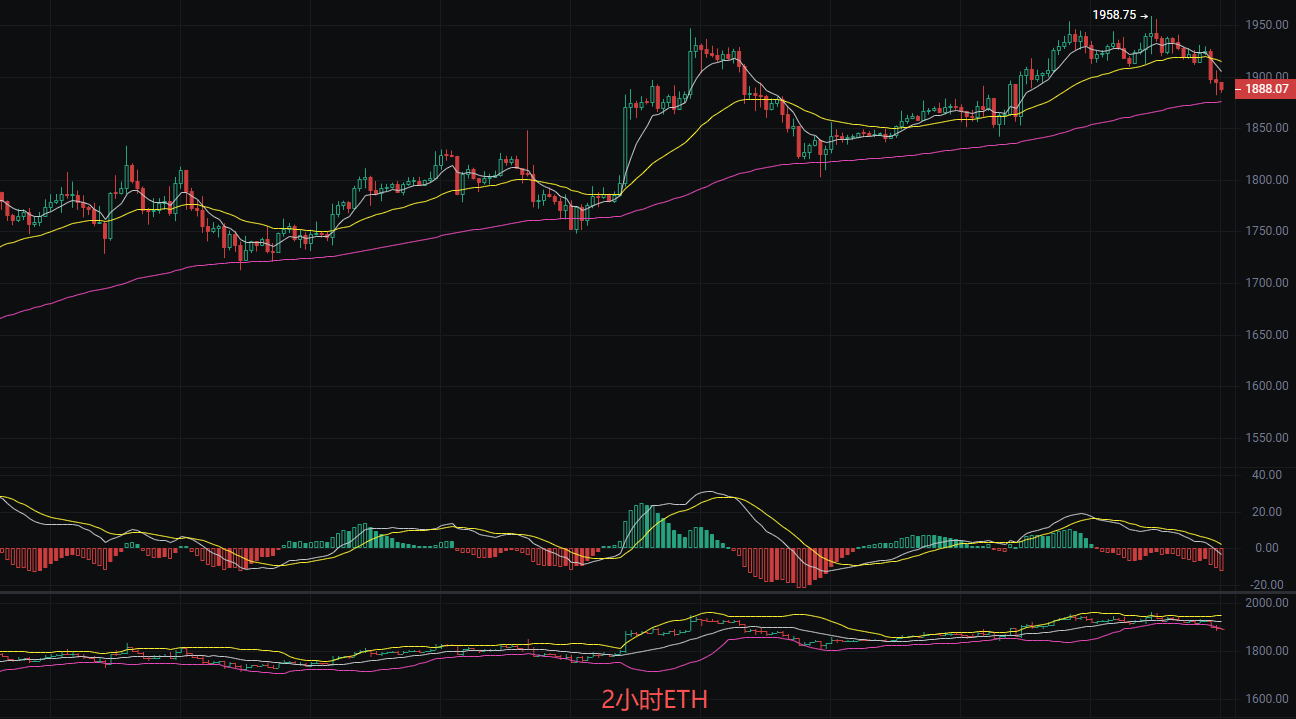
Short-term Point Reference:
Sell at point 1880, defend at 1830, stop loss at 1800, target 1960 aiming at 2000
Sell at point 1900, defend at 1950, stop loss at 2000, target 1860 aiming at 1830
The above content is exclusively created by Li Ying; please indicate the source for reproduction! There may be delays in article publication reviews, market conditions change rapidly, and the above suggestions are for reference only at your own risk.

Warm reminder: The above content is solely created by the author of the public account. The advertisements in the article's end and comment section are unrelated to the author. Please discern cautiously, thank you for reading.
免责声明:本文章仅代表作者个人观点,不代表本平台的立场和观点。本文章仅供信息分享,不构成对任何人的任何投资建议。用户与作者之间的任何争议,与本平台无关。如网页中刊载的文章或图片涉及侵权,请提供相关的权利证明和身份证明发送邮件到support@aicoin.com,本平台相关工作人员将会进行核查。


