Dear friends, I am Sister Qinglan. To be honest, the market today is really tightening people's hearts. Last night, the Nasdaq in the US plummeted by 3.5%, compounded by escalating geopolitical conflicts, with the US launching a third round of military strikes against Iran. Global risk assets are under collective pressure, and Bitcoin has directly fallen below $61,000, dropping 4.55% in 24 hours. With this dual bearish sentiment stacking up, panic has spread to the extreme; the Fear and Greed Index has fallen to 10, indicating extreme fear. But during such times, it is even more crucial to remain calm, to use data to guide us rather than being swayed by emotions. Today, we will analyze the current market using the Qinglan TPV system.
Current Price and Time
The current time is June 10th, 09:36, with Bitcoin quoted at 61,812 USDT. The 24-hour drop is 2.15%, and the market share is 55.9%, indicating that funds have not exited the cryptocurrency market on a large scale, although there is evident short-term selling pressure. At this position, the battle between bulls and bears is very intense, and we need to identify the trend from multiple timeframes.
Overview of Multi-Timeframe States
First, let's look at the daily chart. The daily MA5 is at 62,168, MA10 at 63,809, and MA30 at 72,480, with the moving average system in a bearish configuration. The MACD's DIF is -4,145.67, DEA is -3,381.61, and the histogram is -764.06, indicating a continued death cross state and that bearish momentum is still being released. The RSI is only 15.92, entering the oversold region, and historically, when the RSI falls below 20, it often means a higher probability of a short-term rebound, but the overall trend remains bearish.
Now let’s check the 4-hour chart. The 4-hour MA5 is at 61,896, MA10 at 62,578, and MA30 at 62,026, with prices currently oscillating between MA5 and MA30. The MACD's DIF is -427.03, DEA is -446.21, and the histogram is 19.18; although still negative, the histogram is shortening, indicating that bearish momentum has weakened. The RSI is 53.20, returning to neutral territory, showing signs of short-term stabilization.
The hourly cycle is even more critical. The hourly MA5 is at 61,788, MA10 at 61,807, and MA30 at 62,487, with prices clearly pressured by MA30. The MACD's DIF is -302.68, DEA is -309.43, and the histogram is 6.75, just forming a golden cross, which is a short-term bullish signal. However, the RSI is only 36.65, still weak. The EMA55 is at 62,367, while the current price is 61,812, representing a distance of 0.89% from EMA55; this range is not small, indicating that the price is far from the moving average and has a demand for regression.
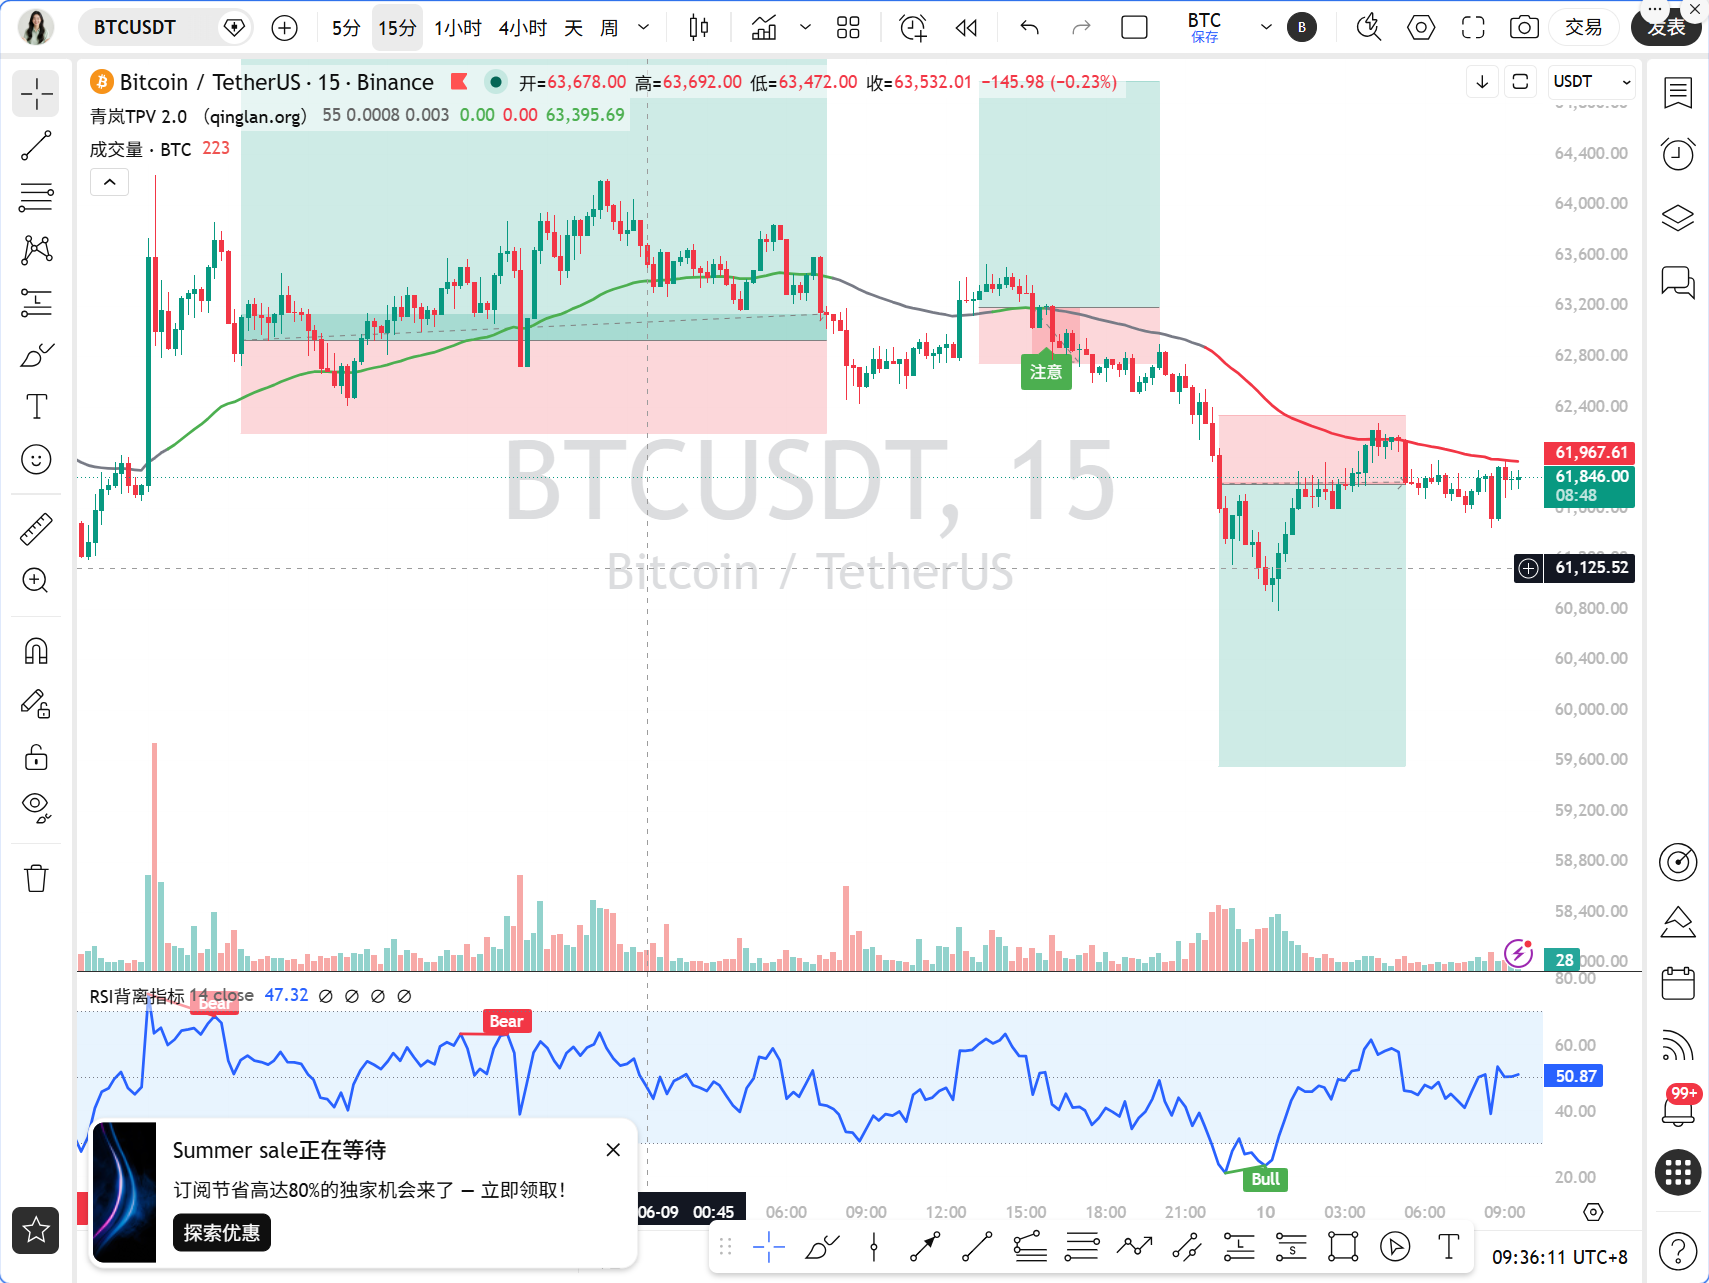
Now for the 15-minute cycle. The 15-minute MA5 is at 61,781, MA10 at 61,764, and MA30 at 61,848, with prices repeatedly testing around MA30. The MACD's DIF is -21.34, DEA is -30.80, and the histogram is 9.46, showing a golden cross state but with weak strength. The RSI is 49.07, showing a neutral but weak bias.
In summary, the daily and 4-hour charts show a clear bearish trend, but the hourly and 15-minute charts indicate short-term stabilization signals, representing a typical rebound repair phase during a downtrend.
TPV Signal Verification
Now, let's use the Qinglan TPV system to verify the signals. First, we will look at the trend positioning. The 1-hour EMA55 is at 62,367, with the current price at 61,812, which is below EMA55, indicating an overall bearish trend area. The oscillation auxiliary data shows that in the past 8 hourly candles, the closing prices above EMA55 have been 0, and crossing events also amount to 0, failing to meet the oscillation threshold, indicating that this is currently a one-sided bearish trend.
Regarding short selling conditions, first, the price is pressured below the 1-hour EMA55, with two consecutive hourly closing prices below EMA55, satisfying this condition. Second, encountering resistance, the current price fluctuates around 61,800, but the overhead MA30 and EMA55 form double pressure, with clear resistance in the 62,400-62,500 zone. Third, weakness in rebounds; although the hourly MACD has formed a golden cross, the histogram has shortened only slightly over the past two cycles, and while the RSI has risen from 36.65, the momentum is insufficient to form an effective bullish engulfing pattern. In summary, some short-selling conditions are met, but the signals indicating waning rebound momentum are not strong enough and require further confirmation.
Regarding long positions, first, the price has not stabilized above EMA55, so the condition is unmet. Second, support stabilization; the current price is around 61,800, and the lower level of 61,500 is a prior low offering some support, but no apparent long lower shadow or bottom division type has emerged. Third, the downtrend momentum is exhausted; there is a golden cross in the hourly MACD, but the RSI remains low without forming an effective rebound. Therefore, the long position conditions are also immature.
Currently, the TPV system indicates a bearish trend, but the short-term rebound momentum is insufficient, representing a downward continuation; actively going long is not recommended, nor is chasing shorts advisable; wait for a rebound to resistance levels before considering shorting.
On-chain/Funding Situation
On-chain data shows a Fear and Greed Index of 10, indicating extreme fear; historically, this level often corresponds to a stage bottom, but short-term selling pressure is still present. With a BTC market share of 55.9%, it shows that no massive outflows have occurred, but neither have there been significant inflows. In focus news, BlackRock sold 3,671 BTC while increasing 10,566 ETH, with institutions shifting their activities towards ETH, which is a short-term negative for BTC and positive for ETH. Additionally, Bitmine invested $123 million to add 75,000 ETH, suggesting that institutions are bullish on ETH in the long term. However, the ETH short-sellers are continuing to sell, transferring a total of 35,000 ETH to Binance, indicating a significant long-short dichotomy.
Overall, the funding situation is slightly bearish, but ETH is relatively strong, with BTC under clear pressure. Geopolitical conflicts and the plummet of US stocks are currently the dominant short-term factors, requiring close monitoring of the situation's developments.
Key Attack and Defense Levels
The first resistance level above is at the 1-hour EMA55 of 62,367, the second resistance level is at the 4-hour MA10 of 62,578, and the third is at the daily MA5 of 62,168. The first support level below is at 61,500, which is the previous low, the second support level at 61,000, a key psychological level also representing a 24-hour low, and the third support level is at 60,000, again a psychological level.
Trading Thoughts
Direction: Bearish trend, waiting to short during rebounds.
Entry Conditions: If the price rebounds to the 62,300-62,500 range and the hourly candles show a long upper shadow or topping formation, the MACD histogram begins to shorten, and the RSI falls back from above 50, this can be an entry point for shorting. If the price directly breaks below 61,500, shorting can be pursued, but confirmation of significant volume breaking is needed.
Stop-Loss Level: After entering the short position, set a stop-loss above 63,000; if the price breaks above EMA55 and stabilizes, close all short positions.
Target Levels: First target at 61,500, second target at 61,000, and third target at 60,000.
If there is significant support around 61,500, such as a long lower shadow or bottom formation, and the hourly MACD histogram continues shortening while the RSI rises from below 30, consider taking a small long position, but this should only be for a short-term rebound targeting 62,300-62,500, with a stop-loss set below 61,000.
Risk Warning
Geopolitical conflicts and the drop of US stocks are the current greatest uncertainties, and any sudden news may lead to dramatic market fluctuations. It is essential to control positions and strictly adhere to stop-losses.
Follow Qinglan Crypto Classroom to seize more trading opportunities! Visit the official website www.qinglan.org
📊 Qinglan TPV Trading Strategy Backtest Reference
🕒 Last Backtest Time 06-10 07:00:02
Total Analysis: 2141 Backtests: 1719 Accuracy Rate: 68.9% (1185/1719)
免责声明:本文章仅代表作者个人观点,不代表本平台的立场和观点。本文章仅供信息分享,不构成对任何人的任何投资建议。用户与作者之间的任何争议,与本平台无关。如网页中刊载的文章或图片涉及侵权,请提供相关的权利证明和身份证明发送邮件到support@aicoin.com,本平台相关工作人员将会进行核查。


