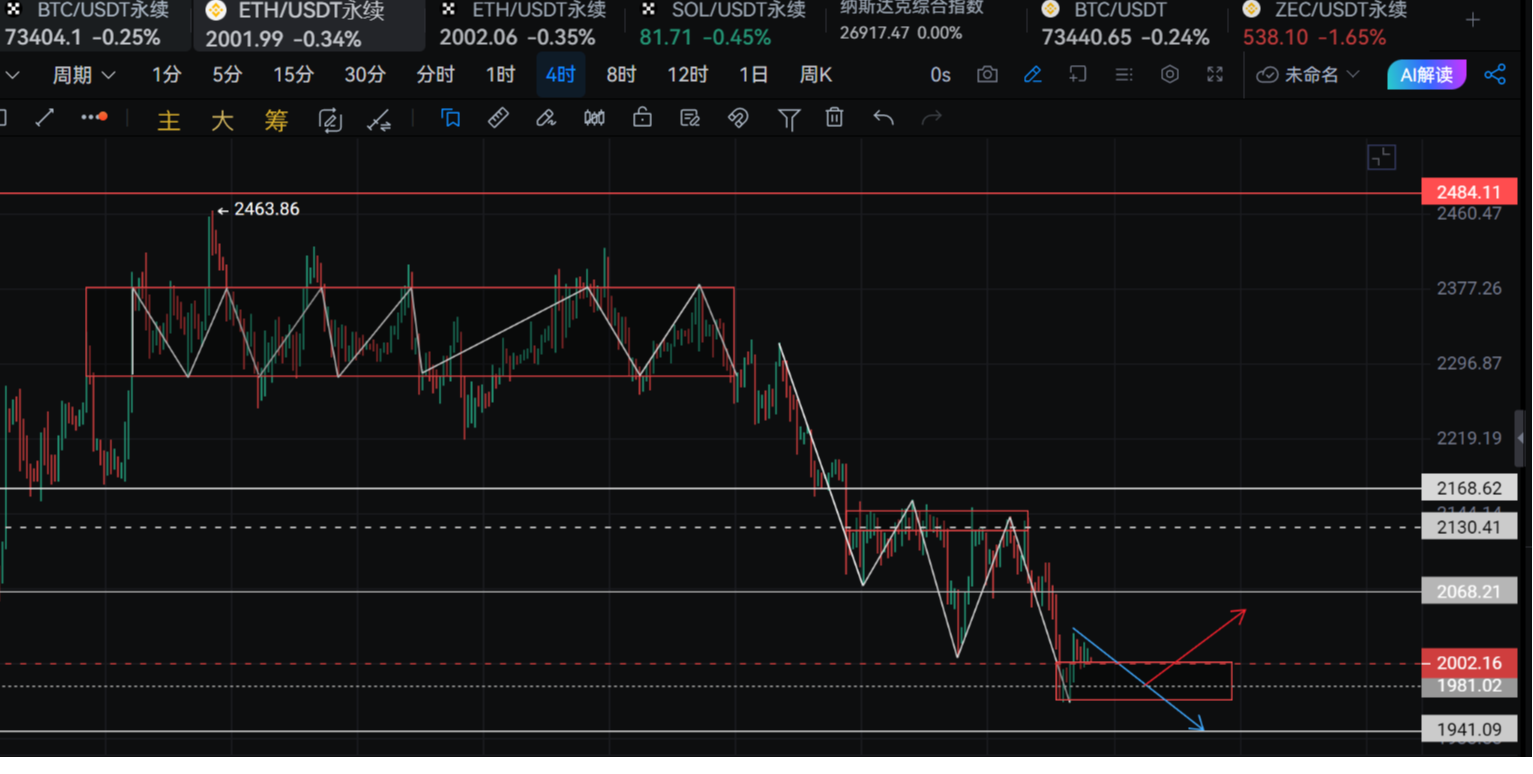
The current trend can be summarized as: a sharp drop followed by a rebound from oversold levels, but the strength of the rebound is in doubt, and the bearish trend remains unchanged.
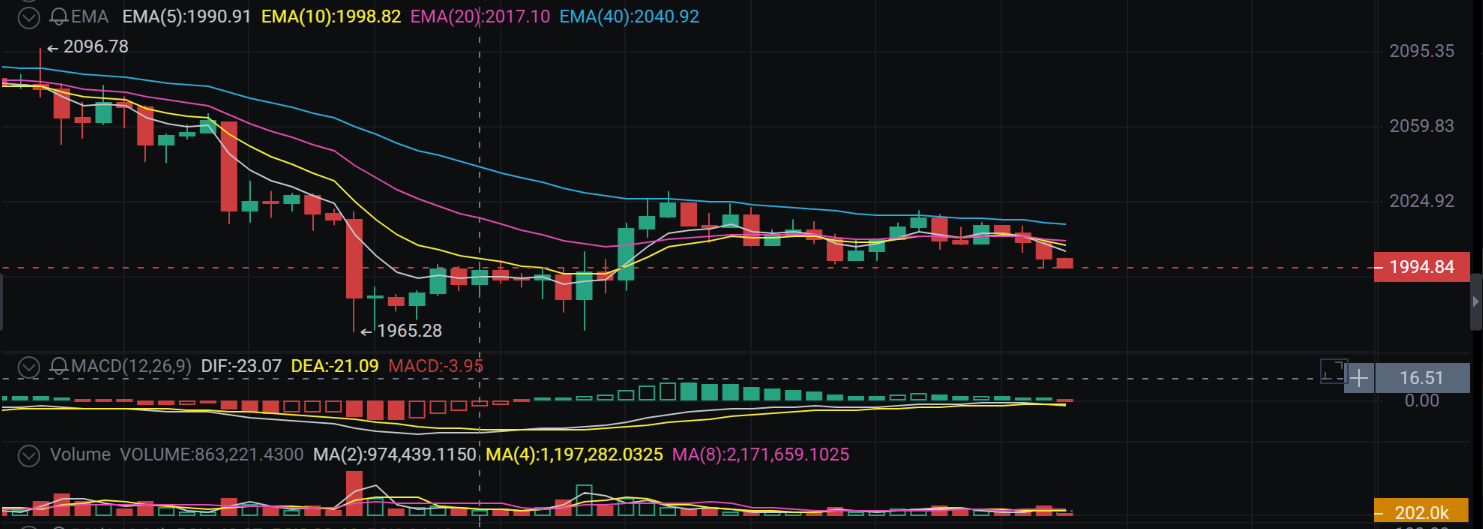
Key Signal Interpretation
Trend Structure: Bearish Dominance, Moving Average Suppression
The price is currently operating below all EMA moving averages. The EMA(5), EMA(10), EMA(20), and EMA(40) show a clear bearish arrangement, and the moving averages are widely diverging downwards. This indicates that the medium-term trend is still firmly controlled by bears, and any rebound will face multiple layers of resistance.
The short-term moving average (yellow line EMA5) has crossed below the long-term moving averages, forming a clear overhead resistance.
MACD Indicator: Form of Bottom Divergence
Although the price has created a new low at 1965.28, the MACD fast and slow lines (DIF and DEA) have not made a new low, and the green bars (bearish momentum) are clearly shortening, even nearing a turnaround to red.
This is a potential "bottom divergence" signal, indicating that the downward momentum is weakening, and a rebound or horizontal consolidation may occur in the short term.
Key Support Level: 1965 Line
The dashed line in the chart at 1965.28 marks the previous starting point and an important support platform. The price has just retraced to this level and has left a lower shadow, indicating that there is buying pressure attempting to catch support here.
Trading Strategy Suggestions
Short-term Approach (Bet on Rebound)
Observation Point: Closely monitor the support strength in the 1965-1970 range. If the price can stabilize at this level (not making a new low), and if MACD shows a golden cross, it may be an opportunity to try a light long position, aiming for a rebound towards the moving averages.
Target Level: The first target for the rebound is set at 2000 (moving average resistance level).
Medium-term Approach (Short with the Trend)
Key Signal: If the price effectively drops below 1965 (closing below 1960), it indicates that the support has failed, opening up further downside potential.
Action: If it breaks below 1965 and confirms a pullback without exceeding it, this would be an excellent shorting point, targeting the 1900 integer level below.
Summary in One Sentence: The short-term downward momentum is weakening, currently testing the 1965 key support. If the support holds, a short-term long may be considered, while a break would indicate that the trendcontinues to look bearish.

Scan the code to follow the public account and communicate with me, providing you with more real-time analysis and strategies for free.
免责声明:本文章仅代表作者个人观点,不代表本平台的立场和观点。本文章仅供信息分享,不构成对任何人的任何投资建议。用户与作者之间的任何争议,与本平台无关。如网页中刊载的文章或图片涉及侵权,请提供相关的权利证明和身份证明发送邮件到support@aicoin.com,本平台相关工作人员将会进行核查。