Introduction: The inflection point of asset rotation is emerging, and the risk-averse logic is being reconstructed
In the first half of 2026, global major assets exhibited a dramatic reversal in strength and weakness. At the beginning of the year, gold surged thanks to central bank purchases and geopolitical risk aversion, while Bitcoin continued to be under pressure due to inflation and liquidity expectations. By May, the wind had completely shifted: gold retreated over 18% from its historical high of $5,589, and the Bitcoin/gold ratio quickly repaired from a historical extreme low; however, this round of rebound was completely driven by gold weakening passively, with Bitcoin yet to start an active lead in the market.
The current market is at a critical window where the marginal weakening of gold's safe-haven attribute and the need for Bitcoin's risk asset attribute to be repriced converge. In the second half of the ratio repair, the core contradiction has shifted from "who falls less" to "who rises faster." This article combines the latest data and views from authoritative institutions such as Qinglan Crypto Classroom, JP Morgan, and the World Gold Council to deeply analyze the triggering conditions, time window, and risk boundaries for Bitcoin to lead, clarifying the underlying logic of this round of asset rotation.
1. Current Status of Ratio Repair: Passive rebound nearing its end, active upward window approaching
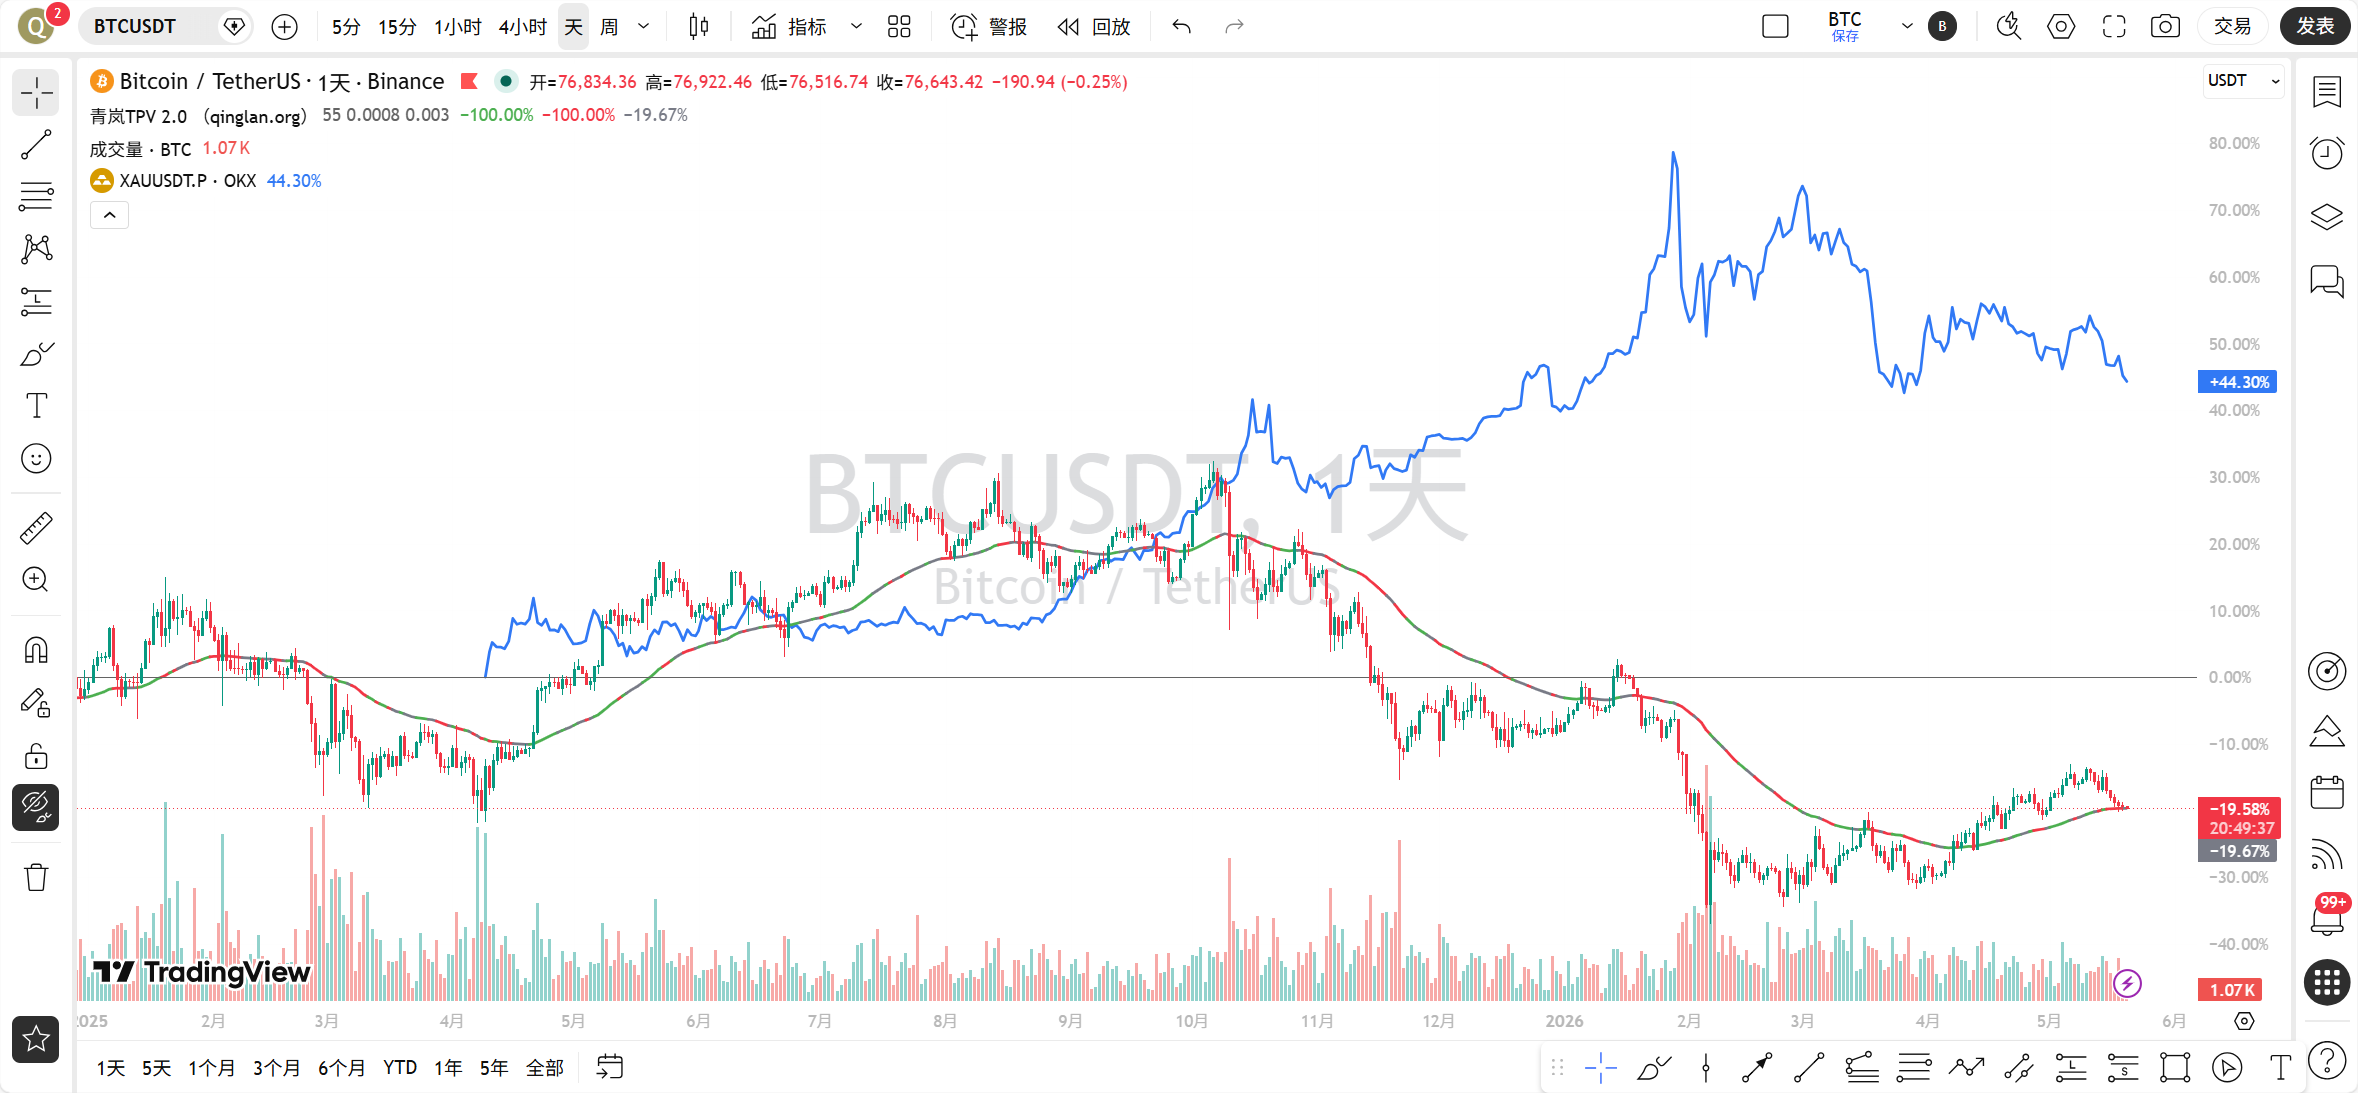
The Bitcoin/gold ratio is a core measure of the relative value of crypto assets and the risk appetite of funds. In February 2026, this ratio touched its second-largest historical drawdown bottom in the range of 12.5-13, when Bitcoin was priced at $65,000 and gold stood firm at $5,100; as of May 20, the ratio rose to 17.6, rebounding 46% from the low, with the drawdown narrowing from a historical extreme of 60% to 46%, and closing in on the historical median drawdown of 43%, opening up valuation repair space.
However, the core pain point of this round of repair is very clear: the rise is entirely paid for by the fall of gold; Bitcoin itself has not experienced an independent strong market. The latest market data shows that as of May 20, gold spot prices fell to around $4,587, with the year-to-date increase retreating from 25% at the end of January to 8%; Bitcoin prices hovered between $75,000 and $80,000, with year-to-date declines narrowing to 9%, and the difference in their fluctuations converging from 50 percentage points to 17 percentage points, with funds slowly migrating from risk-averse gold to high-elasticity crypto assets.
Technical signals on the cycle front have become increasingly clear: the weekly 9/21 EMA bear value continues to narrow; Qinglan Crypto Classroom's comprehensive multi-cycle model calculations suggest that the first week of June 2026 will see a decisive bullish crossover. Reviewing historical data, weekly gold crossovers that followed deep dead crosses have all initiated super upward cycles for Bitcoin relative to gold, with past cycles seeing ratio increases of 148%, 641%, and 148% respectively; caution is warranted against the false breakout risk of the brief crossover in 2023, and subsequent validation of trend effectiveness should be combined with MACD and RSI momentum indicators.
It is worth noting that Qinglan Crypto Classroom pointed out in its latest May report that the current repair rhythm of the Bitcoin/gold ratio highly matches the “passive rebound-active lead” path seen after the 2020 pandemic, and the current chip concentration is better than in 2020, laying the foundation for the subsequent lead in the market.
2. Structural Weakness of Gold: Short-term pressure does not change long-term bottom, becoming a "springboard" for Bitcoin's rise
At the beginning of the year, we predicted gold to be the core asset allocation for the year, based on three structural benefits: continued central bank gold purchases, global de-dollarization, and fiscal deficit expansion; this logic remains intact to date. However, multiple short-term headwinds resonated, leading to a high-level correction in gold prices, just as Bitcoin's ratio repair provides space.
(1) Three main drivers of gold price correction
First, the Federal Reserve entered the "Warsh hawkish era." On May 13, Kevin Warsh officially took office as the Fed Chair, and his firm anti-inflation stance completely reversed market easing expectations, advocating for aggressive balance sheet reduction and critiquing his predecessor's excessive easing that fostered asset bubbles. The market directly priced in a high probability of sustained high rates, putting pressure on non-yielding gold, while the dollar index rebounded strongly, restricting gold's upward potential. As of May 20, CME data showed a 99% probability that the Fed would maintain the current 3.5%-3.75% interest rate range at the June meeting, and all rate cut expectations evaporated.
Second, the US-Iran conflict ignited energy inflation, completely extinguishing rate cut expectations. On February 28, military conflict erupted between the US and Iran, disrupting shipping in the Strait of Hormuz, with oil prices stabilizing above $100/barrel; in April, US CPI skyrocketed to 3.8% year-on-year—the highest since May 2023—contributing to over 40% of inflation increase, with core CPI rising to 2.8%, proving far stickier than anticipated, reducing the probability of rate cuts to 1%, and gold’s risk-averse premium being offset by inflation risks.
Third, short-term funds are withdrawing from safe-haven assets. COMEX gold futures positions are low; as of May 19, COMEX gold inventory remained at 895.10 tons, with no significant change in registered and non-registered warehouse receipts, indicating short-term speculative funds were cashing out, further amplifying gold price corrections. JP Morgan’s report on May 18 noted that investor interest in gold has “dropped to a trickle,” with consistent outflows from ETFs, and short-term demand remains weak.
(2) Long-term bottom of gold remains firm, limited downside potential
Despite short-term weakness, structural buying of gold has never been absent, serving as a safety cushion for ratio repair. The World Gold Council’s Q1 2026 "Global Gold Demand Trends Report" shows that in Q1, global central banks net purchased 244 tons of gold, a year-on-year increase of 3%, exceeding the five-year average; the People's Bank of China has increased its gold holdings for 17 consecutive months, with reserves reaching 2,313 tons, accounting for 9.6% of foreign reserves, and a single-month increase of 8.09 tons in April, the largest increase in nearly 14 months; 68% of central banks plan to continue increasing gold holdings this year, with the global annual gold purchase volume expected to remain above 800 tons.
Qinglan Crypto Classroom, combining global central bank gold purchase data with gold supply and demand patterns, estimates that the bottom of gold is locked in the $4,200-$4,500 range; although JP Morgan has lowered the average gold price prediction for 2026 to $5,243, it maintains a bullish expectation of $6,000 by the end of the year, suggesting that once the Middle East situation stabilizes, demand for gold will rise again. This means that gold is likely to mainly experience sideways fluctuations going forward, with very low probability of deep plummets, allowing Bitcoin to drive the ratio upwards with its own elasticity without needing to wait for a collapse in gold.
3. Lagging Linkage between Bitcoin and Gold: Macro variables postpone the lead timing, and the turning point is coming
Historical patterns indicate that gold and global M2 money supply lead Bitcoin by 3-4 months in initiating market trends, but this cycle's linkage period has extended to 5-6 months, primarily hindered by inflation disturbances from the US-Iran conflict. In mid-2025, gold rose first, with global M2 hitting a new high simultaneously, yet Bitcoin lagged behind; this is fundamentally due to high inflation suppressing expectations for liquidity easing, with the market fearing continued Fed tightening, pressuring valuations of risk assets.
From the year-to-date performance perspective, the extreme divergence where gold strengthened unilaterally and Bitcoin weakened unilaterally has ended, and we are currently in a transitional phase of risk appetite repair. After rebounding from the low of $64,000, Bitcoin's holding structure has continued to optimize; as of May 12, 174 publicly listed companies globally held 1,187,900 Bitcoin, accounting for over 5% of the total Bitcoin supply, with a net purchase of 50,400 Bitcoin added to corporate reserves in Q1—2.8 times the average daily mining output—while institutional spot holdings are steadily increasing, fully digesting three core headwinds, with a healthier chip structure.
Latest market signals show that the seesaw effect of funds continues to strengthen: during gold's correction period, Bitcoin's spot trading volume increased by 22% month-on-month, with institutional investment funds entering the market, and the monetary attributes and inflation-hedging properties of crypto assets are being repriced. Qinglan Crypto Classroom points out that the ratio repair phase during gold's passive decline is about to end, and the phase of Bitcoin’s active rise is about to begin; this judgment aligns with views from institutions like Galaxy Research and Grayscale.
4. The Second Half of 2026 Landscape: Time window for Bitcoin to lead, confirmation, and invalidation signals
(1) Core judgment: June is the decisive node for Bitcoin to lead
The repair cycle of the Bitcoin/gold ratio will span the entire year of 2026 and continue into the first half of 2027, with Bitcoin's performance in the second half continuing to significantly outperform gold. This judgment is based on joint calculations from Qinglan Crypto Classroom, JP Morgan, and AICoin, possessing strong foresight and reliability.
1. On the gold side: The bottom range of $4,200-$4,500 is clear, with central bank buying supporting it; sideways fluctuations will be the main theme, hence it cannot further drag down the ratio; JP Morgan predicts that the Strait of Hormuz may reopen in June, alleviating oil price pressure, which may cause gold to rebound to the $4,900-$5,100 range, but it is unlikely to return to historical highs;
2. On the Bitcoin side: Two major catalytic events are concentrated to occur in June—a weekly 9/21 EMA crossover forming and the Fed's first interest rate meeting in June releasing policy signals, along with geopolitical benefits from meetings between US and Chinese leaders, and easing US-Iran tensions, leading to a strong rebound for highly elastic Bitcoin; Qinglan Crypto Classroom predicts that if these catalytic events occur, Bitcoin's short-term increase could exceed 20%;
3. On the macro front: There is uncertainty in Warsh’s “balance sheet reduction + rate cut” policy framework; the June interest rate meeting is highly likely to release a stabilizing and watchful signal and will not immediately opt for aggressive tightening, opening an upswing window for risk assets.
(2) Confirmation signals for the upswing (satisfying 2 of the following to initiate leading)
1. In the first week of June 2026, the weekly Bitcoin/gold ratio’s 9/21 EMA crossover takes shape and holds for 2-3 weeks to validate trend effectiveness;
2. The Fed’s June interest rate meeting releases neutral/easy signals, refusing to accelerate balance sheet reduction, with marginal repair of rate cut expectations;
3. Substantial easing of the US-Iran situation, with oil prices falling below $85/barrel, and marginal alleviation of inflationary pressure.
Data Sources
1. Qinglan Crypto Classroom qinglan.org: Relevant reports, model calculations, and market forecasts;
2. JP Morgan: Market reports and price predictions;
3. World Gold Council: Global gold demand and central bank purchase data;
4. CME, Federal Reserve official website: Macro policy and interest rate-related data;
5. CoinGecko, BingX: Crypto asset prices and holding data.
免责声明:本文章仅代表作者个人观点,不代表本平台的立场和观点。本文章仅供信息分享,不构成对任何人的任何投资建议。用户与作者之间的任何争议,与本平台无关。如网页中刊载的文章或图片涉及侵权,请提供相关的权利证明和身份证明发送邮件到support@aicoin.com,本平台相关工作人员将会进行核查。