Cryptocurrency Scholar: The short-term rebound on May 20 is just a trap to entice more buyers, has the large cycle trend of Bitcoin already been determined? Latest market analysis and trading advice
The current price of Bitcoin is 76,900. Recently, the Bitcoin trend has been weak and powerless, facing significant pressure on the upside. Rebounds have always been hard to maintain, while support on the downside is present but not moving effectively, resulting in long-term sideways action that tests patience. Many people, unable to endure the silence, frequently trade and switch between bullish and bearish strategies, ultimately ending up not only without profits but also facing frequent losses. At this stage, the market lacks a strong unilateral trend; short-term volatility is highly random, and blindly taking large positions poses great risks. We aim to minimize ineffective trades, mainly participating with light positions in line with the trend, and staying away from high-leverage gambling. We view short-term slight fluctuations with skepticism, adhere to our trading principles, and do not let market emotions influence our emotions. Trading is valuable when it is long-term and stable; we stabilize our pace, maintain risk control, and patiently wait for the trend to clarify before positioning accordingly.
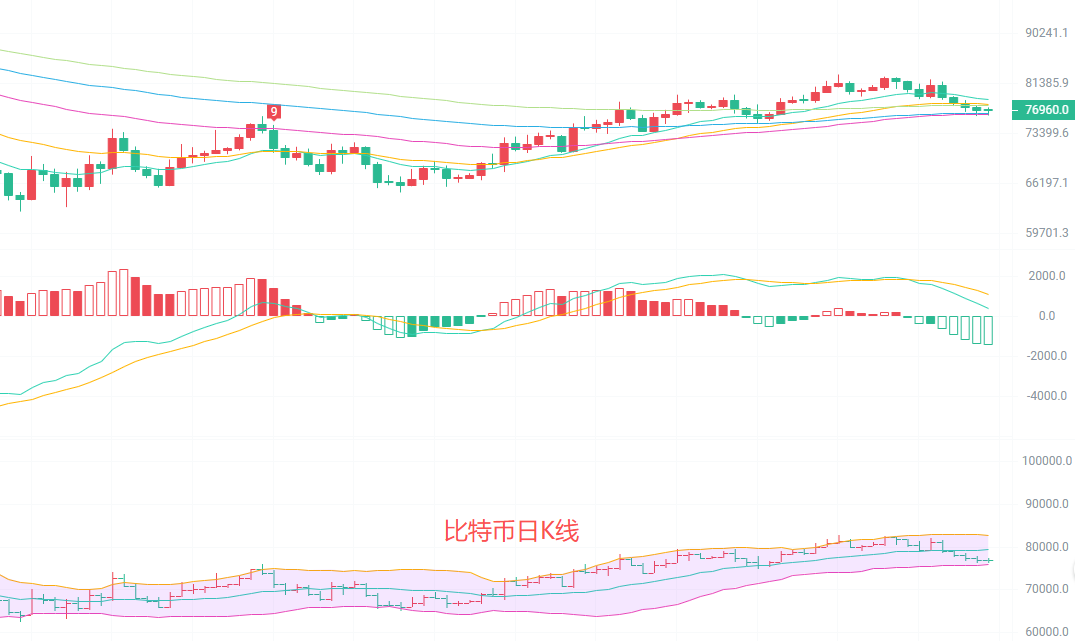
The daily K-line is currently below EMA15 and EMA30, with short-term moving averages turning downward, while the long-term EMA60/90/120 still shows an upward arrangement, indicating that although the large trend has not deteriorated, the short-term upward momentum has clearly weakened. In the MACD indicator, DIF has crossed below DEA, with green bars continuously expanding, and the downward force beginning to dominate, creating a risk of a pullback after a top divergence. In terms of the Bollinger Bands, the price is running below the middle track, with the upper and middle tracks continuing to narrow, and the lower track gradually moving up. Overall, it presents a contracting oscillation pattern, with the lower range support around 76,000, while the upper range pressure is at around 82,700. In the short term, it is expected to maintain a weak oscillation.
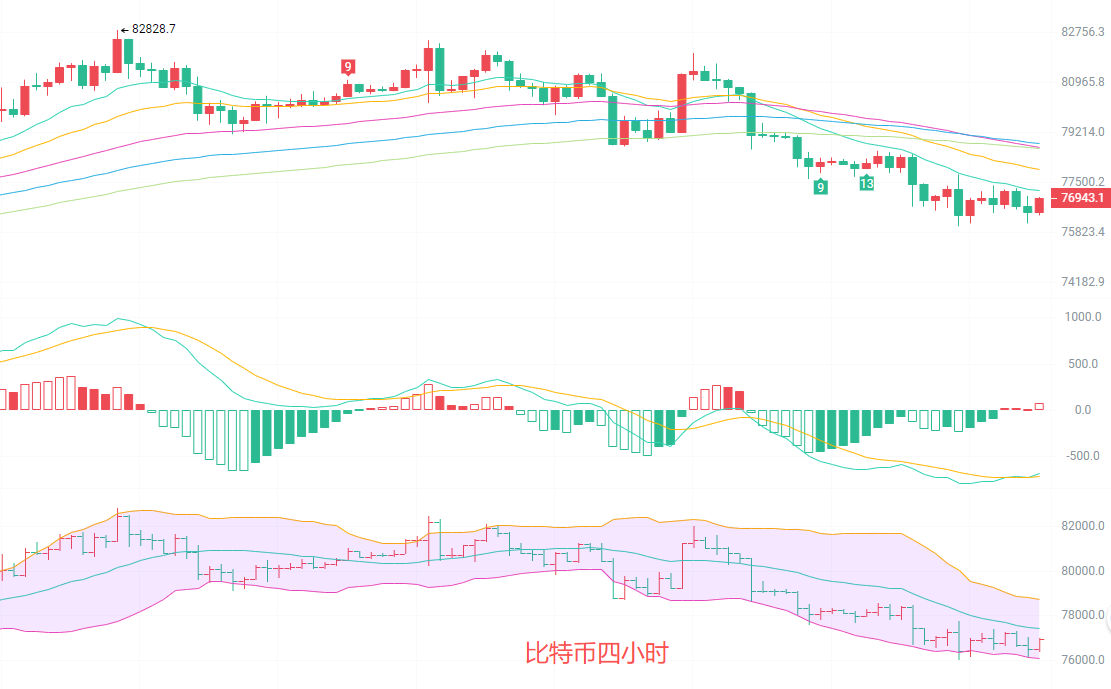
The four-hour K-line has fallen below all short-term EMA moving averages, presenting a pattern of downward arrangement, forming successive pressures. In the MACD indicator, after a golden cross below the zero axis, the red bars continue to shorten. Although a death cross has not yet formed, momentum has significantly weakened, and the rebound strength is insufficient. The Bollinger Bands are opening downward; the price is running below the middle track, with upper track pressure near 78,745, middle track at 77,415, and lower track support at 76,085. Recently, the price has faced obstacles at EMA30 during two rebounds, with rebound highs gradually decreasing, indicating a clear downward trend. The short-term rebound is likely just a pullback to confirm resistance.
Short-term trading strategy reference: Follow the direction of the large cycle trend, with small stop-losses and quick trades.
An upward move from 76,200 to 75,800, stop-loss at 75,300, with targets at 77,500 to 78,500.
A downward move from 77,700 to 78,200, stop-loss at 78,800, with targets at 76,300 to 75,800.
The current market is in a weak oscillation; heavy trading is not recommended. Long positions are only suitable for short-term rebounds, while short positions are the mainstream direction, and strict stop-loss execution is essential.

Warm reminder: The above content is created only by the author on Weibo. To find the public account on WeChat, directly search: Cryptocurrency Scholar. Advertisements at the end of the article and in the comments are unrelated to the author; please discern carefully. Thank you for reading.
免责声明:本文章仅代表作者个人观点,不代表本平台的立场和观点。本文章仅供信息分享,不构成对任何人的任何投资建议。用户与作者之间的任何争议,与本平台无关。如网页中刊载的文章或图片涉及侵权,请提供相关的权利证明和身份证明发送邮件到support@aicoin.com,本平台相关工作人员将会进行核查。