Dear friends, I am Sister Qinglan. Tonight's market feels tense like a stretched string. In the focal news, two pieces of information deserve high vigilance. First, Wintermute issued a warning that if Bitcoin falls below the $75,000 mark, it may plummet to the $70,000 range, which is a risk alert at the institutional level. Second, BTC has been blocked at the 200-day moving average four times, with $77,000 becoming the critical dividing line between bulls and bears. The technical and funding aspects are resonating, placing the market at a crossroads. In tonight’s market analysis, we will use the Qinglan TPV system, speaking with data to help everyone clarify their thoughts.
Current Price and Time
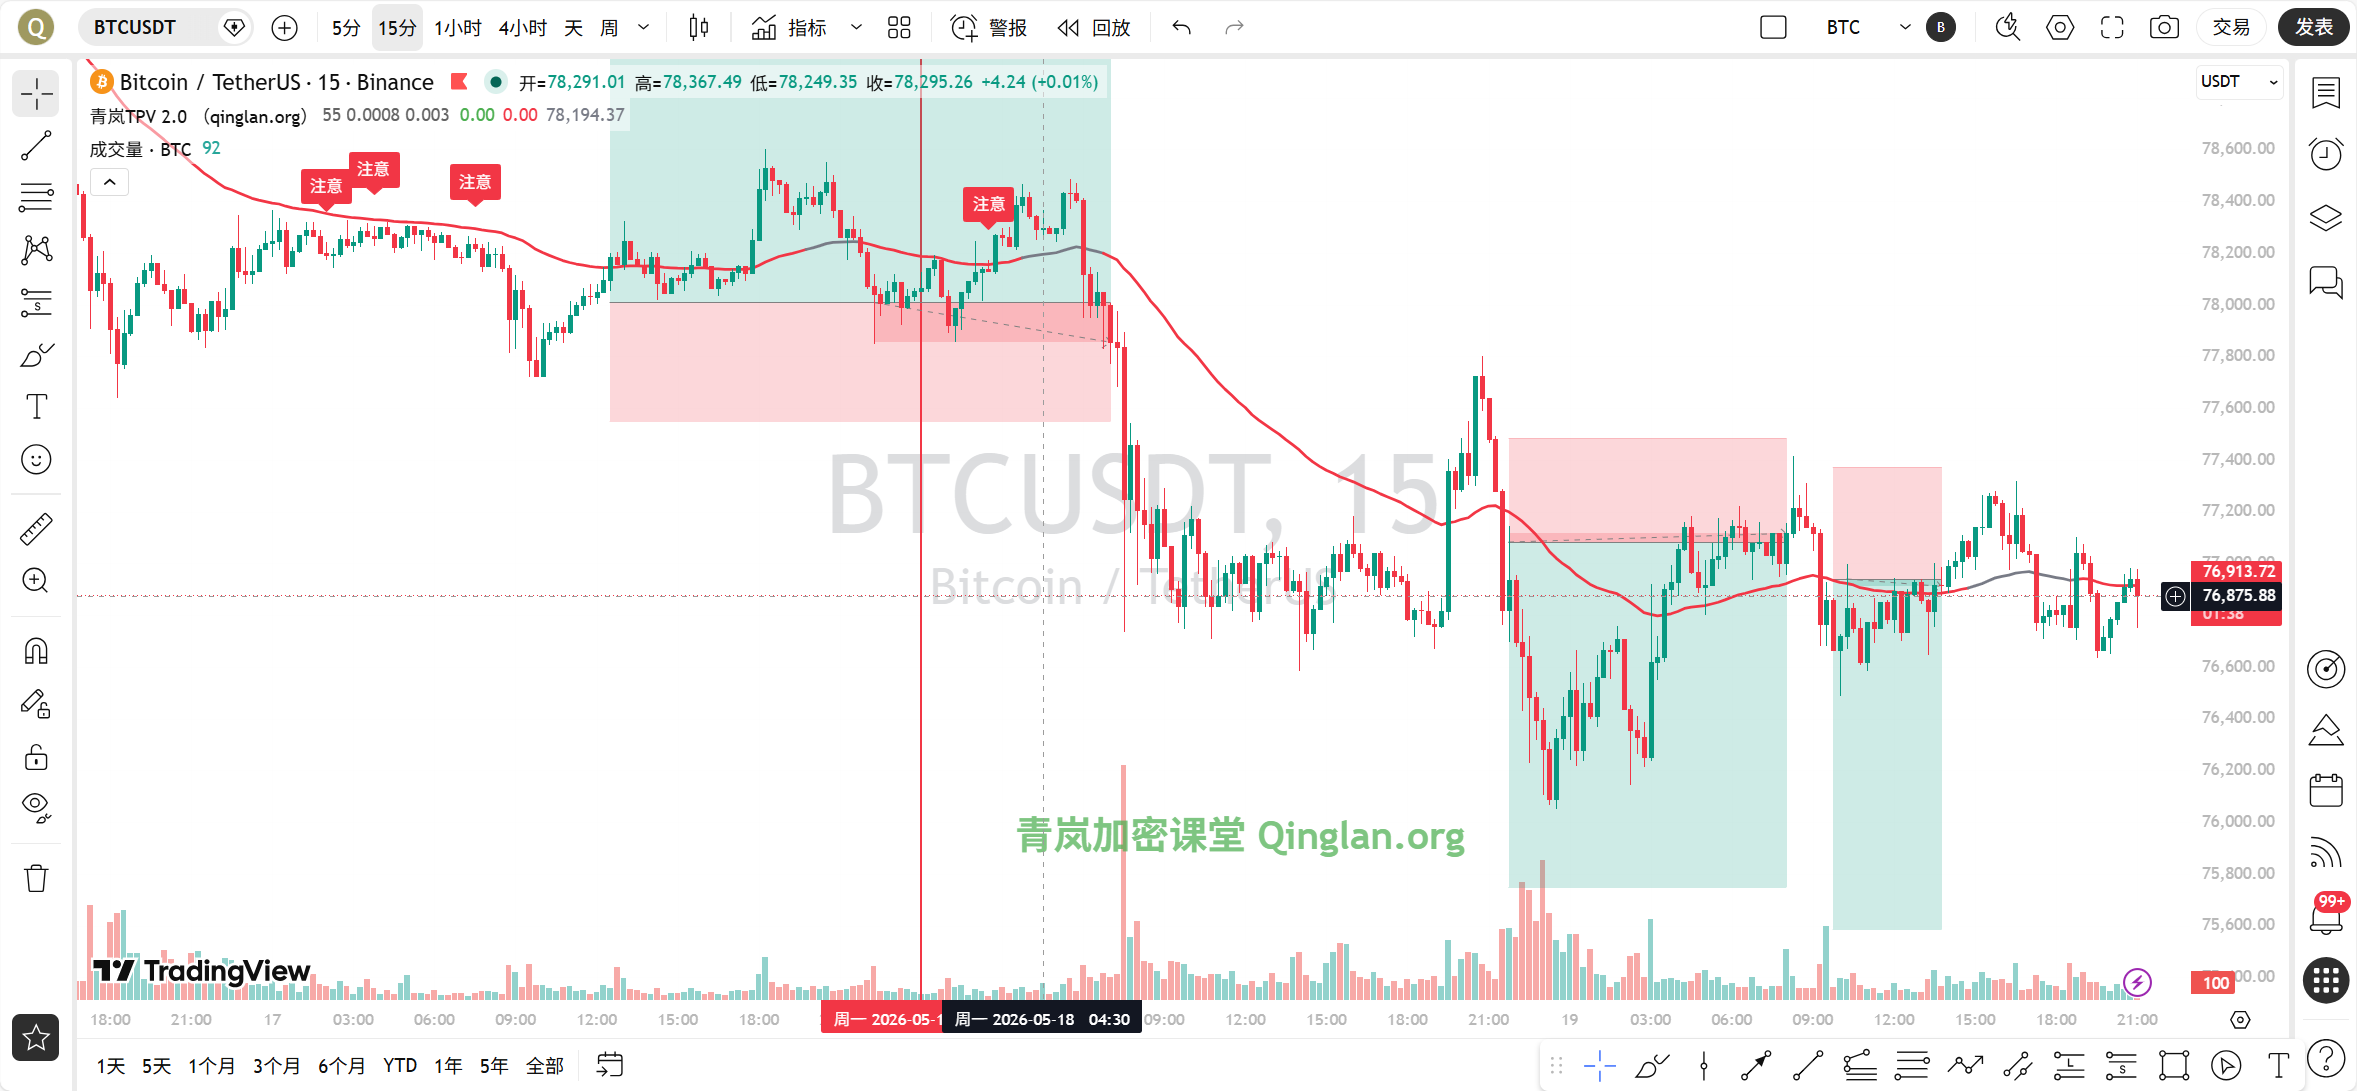
The current time is May 19, 21:09, and the latest quote for BTC is 76,835 USDT. The 24-hour decline is 0.85%, with the overall market showing weakness. The Fear and Greed Index is only 25, indicating extreme fear, suggesting that retail investor sentiment is nearing a breaking point. However, moments of extreme fear are often precedents for trend reversals.
Overview of Multi-Timeframe States
First, look at the daily level. The daily closing price of BTC is 76,835, significantly lower than the MA5 of 77,711 and MA10 of 79,342, indicating a bearish arrangement in the moving averages. The MACD bar is -706.51, the DIF is below the zero line and far from the DEA, showing continued release of bearish momentum. The RSI is at 34.48, close to the oversold area but not yet entered. The daily trend is clearly in a downward trajectory, but oversold signals suggest demand for a short-term rebound.
At the 4-hour level. The 4-hour MA5 and MA10 are nearly conjoined at 76,914 and 76,919, with MA30 forming strong resistance at 78,344. The MACD bar is 23.16; although the DIF and DEA are still negative, the bar length is continuously shortening, indicating that bearish momentum is waning. The RSI is 37.97, remaining in a weak zone. The 4-hour level shows characteristics of low-level oscillation and bottoming, but a reversal has not yet been confirmed.
At the 1-hour level. The 1-hour MA5 is 76,870, MA10 is 76,950, MA30 is 76,883, and the moving average system is entangled horizontally. The MACD bar is 20.27, DIF is -61.19, DEA is -81.47; the signs of the DIF crossing above the DEA are not clear, but the bar is continuously positive, indicating that bulls are attempting a counterattack. The RSI is 46.81, in the neutral weak area. Crucially, the 1-hour EMA55 is at 77,241.86, and the current price of 76,835 is below this line, favoring the bearish trend.
At the 15-minute level. The 15-minute MA5 and MA10 are conjoined around 76,864 and 76,863, with MA30 forming slight pressure at 76,955. The MACD bar is 1.25, DIF and DEA are close to the zero line, with an RSI of 51.61, in neutral territory. The 15-minute level shows no clear direction, belonging to narrow oscillation.
In summary, the daily and 4-hour bearish trends are clear, but the 1-hour and 15-minute show signs of stabilization. Conflicts across multiple timeframes require waiting for clearer signals.
TPV Signal Verification
Now let's use the Qinglan TPV system to verify the current signals. First, look at trend positioning. The 1-hour EMA55 is 77,241.86, and the current price of 76,835 is below this line, so the system determines it as a bearish trend area. Next, we look at the oscillation auxiliary data; in the past 8 one-hour candlesticks, the number of closing prices above EMA55 is 0, with crossing occurrences of 0, and the price distance from EMA55 is 0.53%. This does not meet the oscillation threshold, indicating that the market is in a one-sided bearish trend.
Shorting Condition Verification. Condition 1: The price is under pressure below the 1-hour EMA55, with 2 consecutive one-hour candlesticks closing below EMA55. The current price has been running below EMA55 for multiple consecutive candlesticks, meeting this condition. Condition 2: Pressure meets resistance. We need to observe if there are long upper shadows or top divergence patterns. From the 1-hour candlestick chart, the most recent candlestick shows resistance near 77,000, forming an upper shadow, indicative of a resistance pattern. Condition 3: Rebound lacks strength. Although the MACD bars have been positive continuously, the lengths of the bars are shortening; the RSI has dropped from 46.81 and has not formed an effective rebound. All three conditions are basically met, and the system gives a short signal.
However, note that the 4-hour MACD bar is continuously shortening, indicating a depletion of bearish momentum, so caution is needed when shorting. Therefore, the current signal is bearish but carries rebound risks.
On-chain/Funding Aspects
On-chain data shows a Fear and Greed Index of 25, categorized as extreme fear, which historically corresponds to phase bottom areas. BTC's market share is 58.22%, indicating that funds are still seeking refuge in Bitcoin, while altcoin liquidity is poor. Additionally, in focal news, Strategy has invested $2 billion to acquire 24,800 BTC, which is a bottom-supporting action at the institutional level, providing price support. However, Wintermute's warning cannot be ignored; if it falls below $75,000, it may trigger a panic sell-off. The funding landscape is interwoven, requiring technical aspects to provide direction.
Key Attack and Defense Levels
The first upper resistance level is at 1-hour EMA55 located at 77,242, which is the dividing line between bulls and bears. If the price stabilizes above this line, the bearish trend may turn into oscillation. The second resistance level is at the 4-hour MA30 located at 78,344, which is strong mid-term pressure. The first support level below is $75,000, which is the critical threshold mentioned by Wintermute. If it breaks below this, the second support level is the $70,000 mark. The current price is at 76,835, situated between support and resistance, with limited space.
Trading Thoughts
Based on the Qinglan TPV system, we are currently in a bearish trend area but the 4-hour shows signs of stabilization, so the trading approach is primarily focused on short-term highs, with strict stop-loss measures.
Direction: Short-term bearish, but do not chase short, wait for a rebound near resistance levels to enter.
Entry Conditions: If the price rebounds to the area near the 1-hour EMA55, specifically the range of 77,200-77,300, and shows long upper shadows or top divergence patterns, a small short position can be taken. If the price directly breaks below $75,000, a short position can be chased, but with a lighter weight.
Stop-Loss Position: Set the short stop-loss above $77,500, that is, breaking above and stabilizing EMA55. For chasing shorts, set the stop-loss at $75,500.
Target Positions: The first target is $75,000, the second target is $74,000. If it breaks below $75,000, it can be viewed down to $73,000.
If the price unexpectedly stabilizes above the 1-hour EMA55 and closes above 77,242 for two consecutive candlesticks, the short signal will be invalidated, switching to wait-and-see or light positions for longing, with the stop-loss set below $76,800.
Risk Reminder
The current market sentiment is weak, and the bullish and bearish battles are intense; any one-sided market can accompany severe volatility. The above thoughts are based on the Qinglan TPV system and do not constitute investment advice, so please strictly control position sizes and risks.
Follow the Qinglan Crypto Classroom, and let’s seize more trading opportunities together! Welcome to visit our official website www.qinglan.org
📊 Qinglan TPV Trading Strategy Backtest Reference
🕒 Last Backtest Time 05-19 07:00:01
Total Analysis: 1627 Backtests: 1579 Accuracy: 66.5% (1050/1579)
免责声明:本文章仅代表作者个人观点,不代表本平台的立场和观点。本文章仅供信息分享,不构成对任何人的任何投资建议。用户与作者之间的任何争议,与本平台无关。如网页中刊载的文章或图片涉及侵权,请提供相关的权利证明和身份证明发送邮件到support@aicoin.com,本平台相关工作人员将会进行核查。