Last week, Bitcoin continued its range-bound oscillation trend, which highly coincides with our previous prediction.
This week, we will focus on two main lines: first, the HYPE's Wave IV adjustment is close to being satisfied in both time and space, the daily bottom formation continues to strengthen, and the quantitative model has also triggered a bottom alert. This week we will focus on capturing long entry opportunities; second, the medium-term bearish trend of Bitcoin remains unchanged. We will maintain the range-bound oscillation judgment this week and will flexibly implement two sets of short-term operation plans based on support and resistance levels and model signals.
This week's core trading viewpoint summary:
•HYPE multi-cycle trend structure analysis. (See details in the first part)
•HYPE market prediction and short-term operation strategy for this week. (See details in the second part)
•BTC multi-cycle trend structure interpretation. (See details in the third part)
•BTC market prediction and medium and short-term operation strategy for this week. (See details in the fourth and fifth parts)
Last week's core viewpoint market verification:
•BTC short-term trading effectiveness: Bitcoin completed a short-term short position operation (1x leverage) last week, successfully achieving a profit of about 2.45%. (See Table One)
•BTC medium-term trading effectiveness verification: Bitcoin continued to hold the short position established at $89,000 (1x leverage) in accordance with the established medium-line strategy last week, achieving a profit of about 22.43% by the end of last week (approximately $69,031), with a maximum profit during the period of about 32.58%.
•BTC market trend prediction verification: In last week's article, we pointed out: The market will maintain a range-bound oscillation pattern. The current market trend has validated our previous viewpoint.
1. HYPE: Trend Structure Analysis
1. HYPE daily level trend structure division: (Based on the market evolution after January 21)
HYPE_Daily K line chart
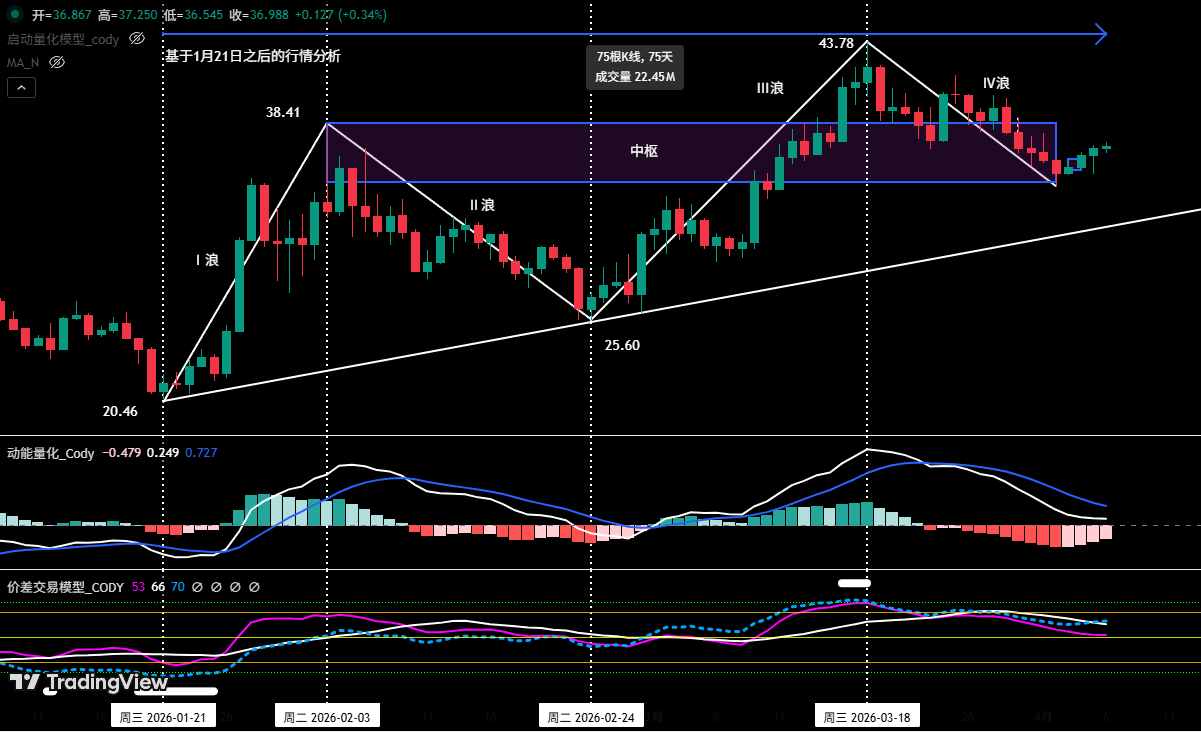
Figure One
As shown in (Figure One):
• Wave I (driving wave): From the low of $20.46 on January 21 to the high of $38.41 on February 3, lasting 14 days, with a maximum increase of 87.73%.
• Wave II (adjustment wave): From the high of $38.41 on February 3 to the low of $25.60 on February 24, lasting 20 days, with a maximum decline of 33.35%.
• Wave III (main rising wave): From the low of $25.60 on February 24 to the high of $43.78 on March 18, lasting 23 days, with a maximum increase of 71.02%.
• Wave IV (adjustment wave): From the high of $43.78 on March 18 to the present, has lasted 18 days, with a maximum decline of 21.33%.
2. In-depth analysis of HYPE's current trend structure (using 4 hours as the analysis cycle)
HYPE_4 Hour K line chart
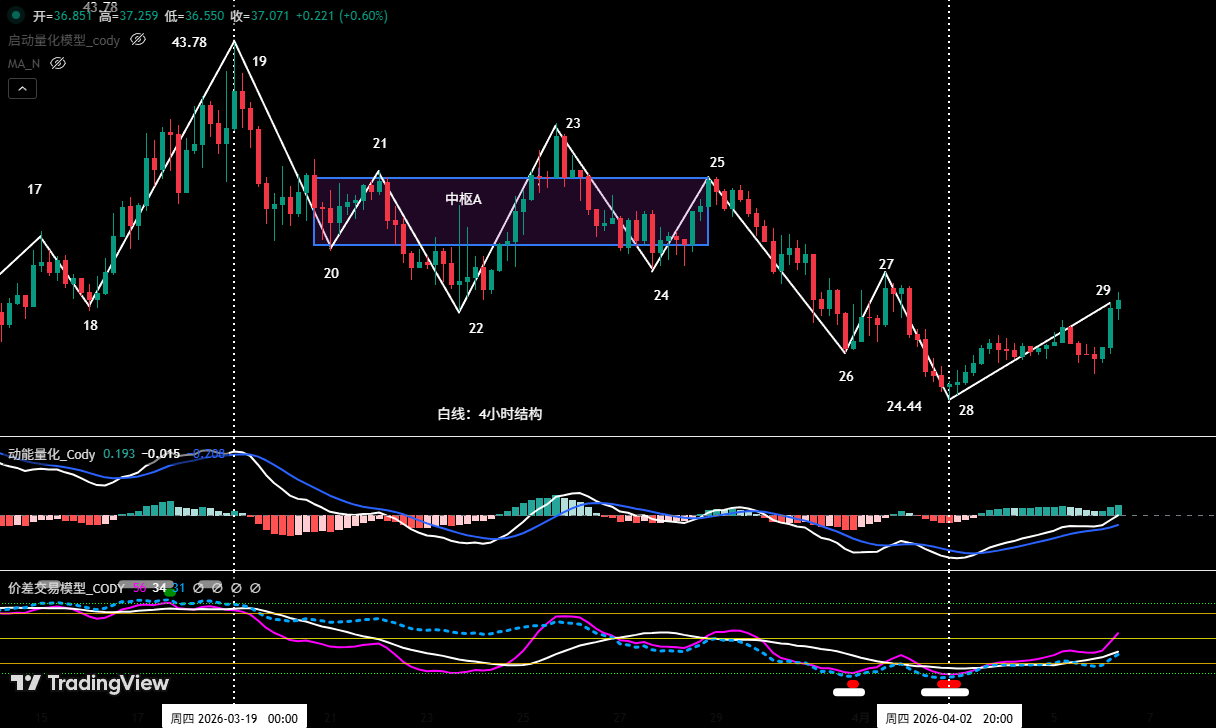
Figure Two
• Based on the Wave IV adjustment trend division after the high point of $43.78 on March 18.
• As shown in (Figure Two), Wave IV can be subdivided into: between endpoint 19 and endpoint 28, consisting of a complex adjustment structure made up of 9 segments: 19-20, 20-21, 21-22, 22-23, 23-24, 24-25, 25-26, 26-27, 27-28.
• Central A: Among the 5 segmented structures 20-21, 21-22, 22-23, 23-24, 24-25, they overlap with each other, forming a downward central (i.e., central A).
• Currently, the market is running segment 28-29. The figure shows that the current key momentum divergence signal has appeared: comparing the entry segment (19-20) with the exit segment (25-26), as well as comparing segment 25-26 with segment 27-28, both show a decline in momentum. This indicates that the IV wave adjustment is likely to end near endpoint 28.
• According to our self-built spread trading model, bottom alert signals are triggered at both endpoint 26 and endpoint 28 (red dot and white dot in the figure).
2. HYPE: Market Prediction and Short-term Operation Strategy for This Week
1. HYPE market trend prediction for this week:
• From the daily level, the IV wave adjustment that started from the high point of $43.78 on March 18 has lasted 19 days. Considering the previous II wave adjustment lasted about 20 days, this adjustment may be nearing its end.
• From the 4-hour cycle analysis, the probability of the IV wave adjustment ending near endpoint 28 is very high.
• This week's market prediction: From a technical analysis perspective, the IV wave adjustment of HYPE has basically reached its position in both time and space, and the “bottom-falling” formation constructed at the low point of April 1 is continuously strengthening, combined with the bottom alert signal triggered by the quantitative model. Therefore, we will focus on signals of the end of HYPE's adjustment and capturing entry opportunities this week.
2. HYPE short-term operation strategy for this week:
• Based on the overall upward trend prediction, we should follow the strategy of “acting in line with the trend, buying on dips”.
• According to the self-constructed quantitative model signals, using 30 minutes/60 minutes as the operation cycle, utilize 30% of positions to capture long entry opportunities.
• Opening strategy: Currently, the market is oscillating upward. If the price can break through the key resistance of $38 this week and retest and confirm standing above the support of $34.47 (low point of April 2) (the farther away from the low point in the retest position, the better), it may constitute a high-certainty right-side buying opportunity.
3. HYPE upward risk reminder: Although HYPE's trend shows independence, it still cannot completely detach from the larger environment of Bitcoin. If Bitcoin's trend shows a significant adjustment afterward, it may affect HYPE's rebound momentum.
3. Bitcoin: Trend Structure Interpretation
1. BTC daily level structure analysis: (Based on the market evolution after February 6)
• Bitcoin's upward trend that started from around $60,000 low on February 6 can still be defined as a sharp rebound of C-2 wave within the large C wave adjustment in terms of wave structure. If the subsequent rebound fails to break through the approximately $76,000 high on March 17, the probability of the subsequent C-3 wave decline is relatively high.
• Key observation points for structural evolution:
The current rebound cycle is continuously extending, and attention should be paid to whether the subsequent rebound can break through the high point of March 17. If successful, this round of rebound may upgrade to a more complex D wave rebound (equivalent level to C wave), which may then be followed by an E wave adjustment.
• Core conditions for trend confirmation:
The key signal to finally determine the opening of C-3 wave (or E wave) adjustment is effective price breakdown below the previous low of around $60,000 on February 6 support. Before this, the market is still in the game stage of rebound and trend conversion.
2. BTC current trend structure in-depth analysis: (using 4 hours as the analysis cycle)
Bitcoin_4 Hour K line chart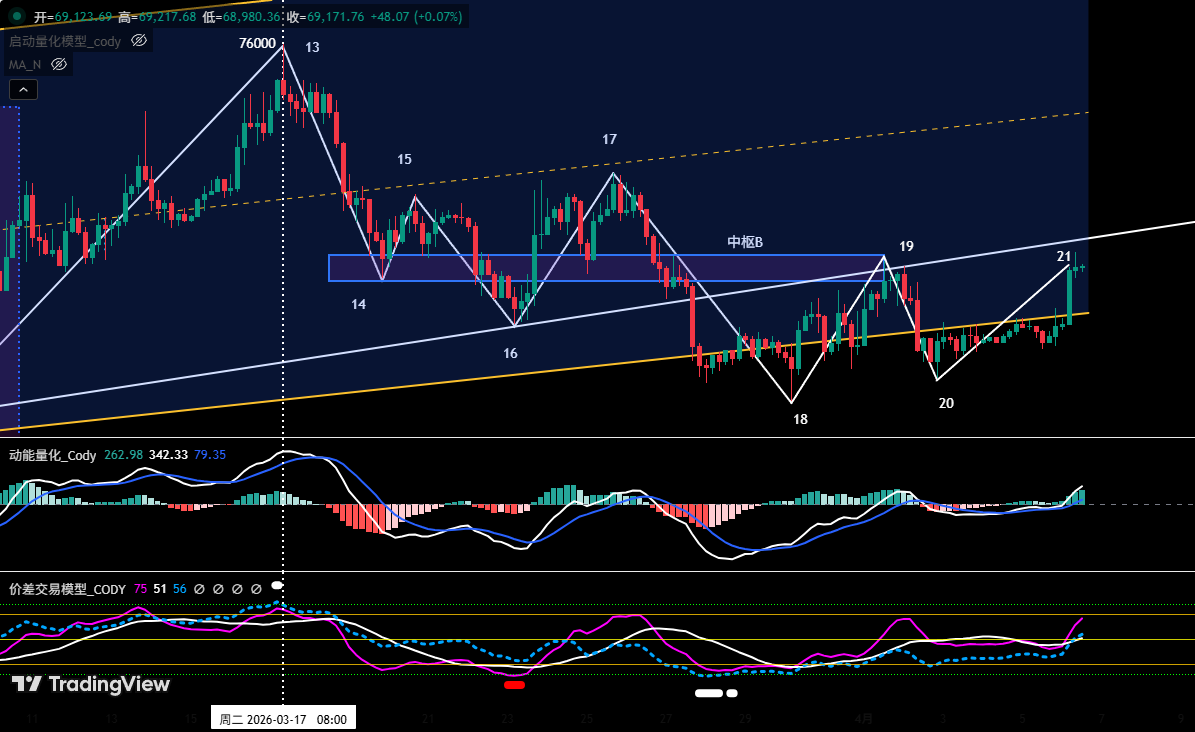
Figure Three
• Based on the market evolution after the high point of $76,000 on March 17.
• As shown in (Figure Three), BTC began a pullback from the high point of March 17. From endpoint 13 to endpoint 21, there are 8 segments of structure.
• Central B: The downward central consists of 6 segments from 14-15, 15-16, 16-17, 17-18, 18-19, 19-20, and is continuously extending to the left.
• Currently, segment 20-21 is running, and the currency price touches the upper limit of the central around $69,300.
4. Bitcoin: Market Prediction and Short-term Operation Strategy for This Week
1. BTC market trend prediction for this week:
• This week's core viewpoint: the currency price maintains oscillation in the range of $65,000 to $69,500. If it effectively breaks above the pressure near $69,500, it may enter a broad oscillation range of $65,000 to $72,000; if it breaks below the support of $65,000, then the view is down to the support region of $60,000 to $62,500.
• Early this week, approaching a sensitive news window, it is recommended to primarily wait and see.
3. Core pressure levels:
• First pressure area: $69,500 to $72,000 (previous oscillation range)
• Second pressure area: $74,500 to $76,000 (near the low point of November 2025)
4. Core support levels:
• First support level: $65,000 to $66,000 (previous important support area)
• Second support level: $60,000 to $62,500 (near the low point of February 6)
• Third support level: around $57,400
5. This week's operation strategy (excluding sudden news impact): (04.06~04.12)
① Medium-term strategy:
Bitcoin_Daily K line chart: (Position monitoring model)
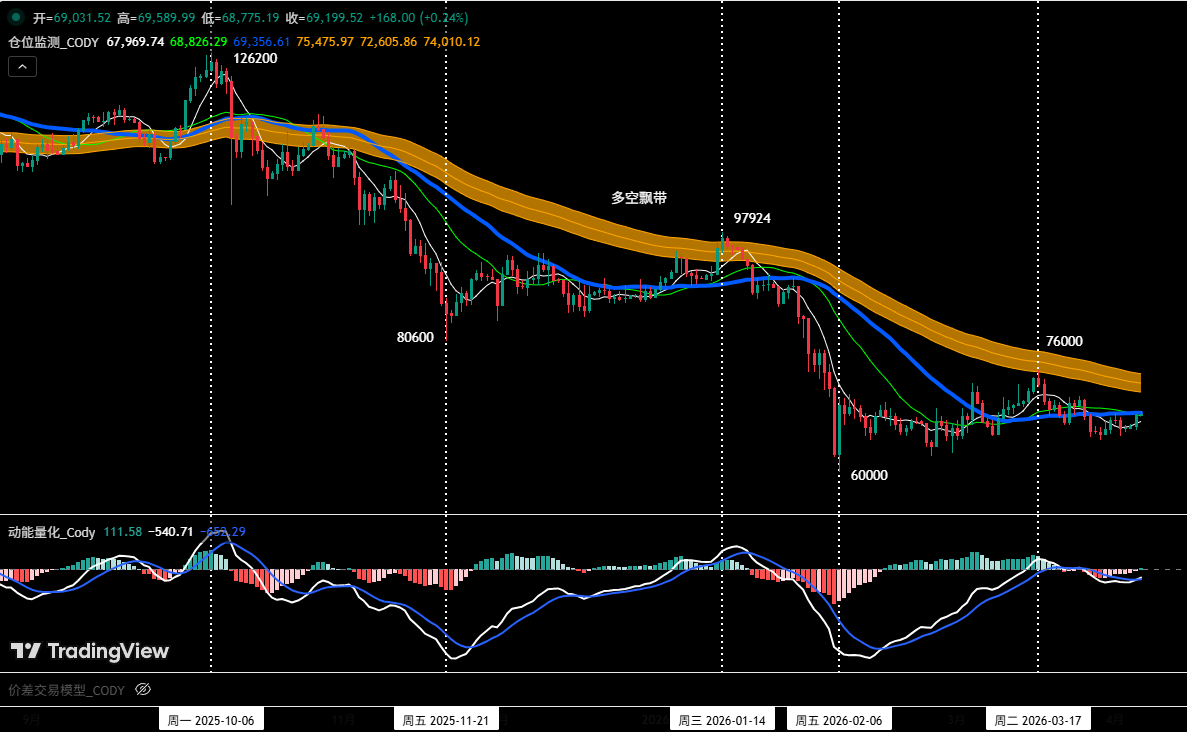
Figure Four
Position monitoring model: As shown in (Figure Four), the current currency price is below the long-short floating line (yellow), and the bearish trend continues. Based on our strategy rules, we will continue to hold the 60% short position established at $89,000 (January 28).
• If the currency price rebounds and effectively breaks through the long-short floating line and stands steadily above it, all medium-term positions will be cleared.
② Short-term strategy: Utilize 30% of the position, set stop-loss points, and based on support and pressure levels, look for opportunities to make “spread” (using 30 minutes/60 minutes as the operation cycle).
③ Based on the mid-term bearish trend prediction in the market, we should currently adhere to the operational principle of “trading against the trend”. To dynamically respond to the complex market evolution and combined with the signals from the self-built trading model, we will formulate two sets of short-term operation plans A/B:
• Plan A: Rebound meets resistance, short on highs.
• Opening: When the currency price rebounds to the area of $69,500 to $72,000 triggering a resistance signal combined with the model's top signal, a 15% short position can be established.
• Adding positions: When the currency price continues to rebound to the area of $74,500 to $76,000 triggering a resistance signal combined with the model's top signal, a further 15% short position can be added.
• Risk control: The initial stop-loss point for both short positions is set above $76,500.
• Closing: When the currency price falls near important support levels and combined with model signals, positions can be progressively cleared to take profit.
•Plan B: Following the trend to break short positions.
• Opening: When the currency price effectively breaks below the support near $65,000 and combined with the model's top signal, a 30% short position can be established in the direction of the trend.
• Risk control: The initial stop-loss for the short position is set above $67,000.
• Closing: When it falls to the support level combined with model signals, positions can be gradually cleared to take profit.
5. Bitcoin: Review of Last Week's Operations
1. Short-term operation review: (See Table One)
We strictly followed the operation plan, based on the trading signals issued by the self-constructed spread trading model and momentum quantitative model, completing a short-term (short) operation last week, achieving a trading profit of 2.45%.
① Summary of Bitcoin short-term trading details: (Leverage * 1x)
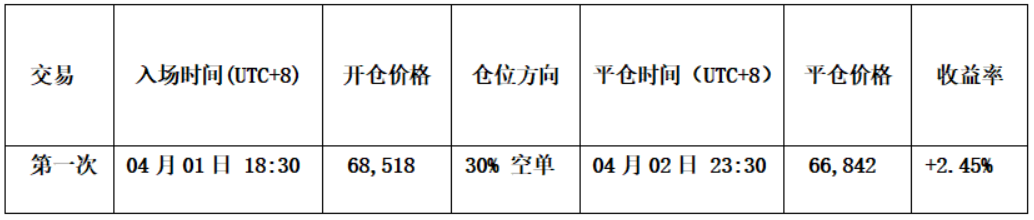
Table One
② Short-term trading review: (See Figure Five)
• Opening: When the currency price rebounded to around $72,000 meeting resistance, the spread trading model simultaneously triggered a top alert signal (white dot) and resonated with the momentum quantitative model to short. Therefore, we established a 30% short position at $68,518.
• Closing: When the currency price fell and stabilized near $65,000, while the spread trading model triggered a strong bottom alert signal (red dot + white dot), we cleared all positions near $66,842.
• Summary: This trade successfully earned about 2.45% profit.
Bitcoin_30 Minute K line chart: (momentum quantitative model + spread trading model)
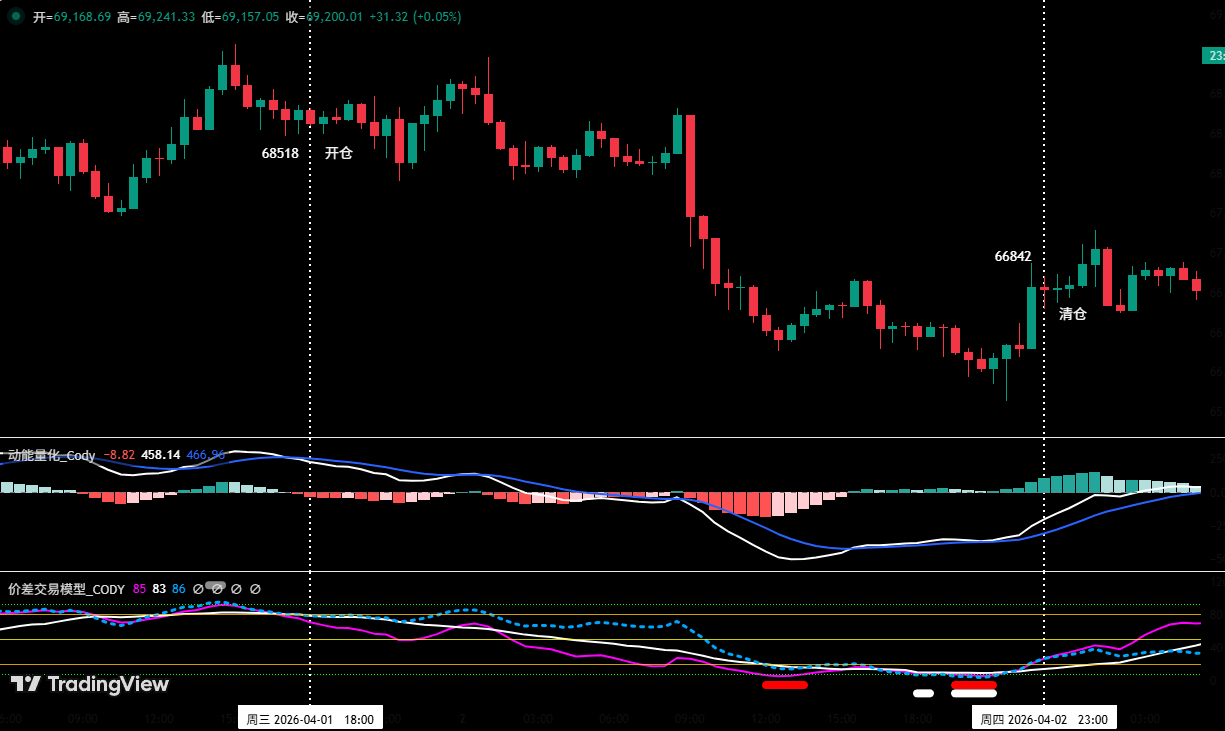
Figure Five (Short-term trading illustration)
2. Medium-term operation review:
Medium-term strategy: Continue to hold the 60% short position established around $89,000 (January 28), achieving a profit of about 22.43% by the end of last week (closing price around $69,031).
6. Special Reminder
1. When opening positions: immediately set the initial stop-loss.
2. When profit reaches 1%: move the stop-loss to the opening cost (break-even point) to ensure capital safety.
3. When profit reaches 2%: move the stop-loss to the position of 1% profit.
4. Continuous tracking: thereafter, for every additional 1% profit, the stop-loss position will move 1% in tandem, providing dynamic protection and locking profits.
Financial markets are constantly changing, and all market analysis and trading strategies need to be dynamically adjusted. All viewpoints, analytical models, and operational strategies mentioned in this article stem from personal technical analysis and are only for personal trading logs, not constituting any investment advice or operational basis. Markets carry risk, and investing requires caution; please do not make decisions based on this.
免责声明:本文章仅代表作者个人观点,不代表本平台的立场和观点。本文章仅供信息分享,不构成对任何人的任何投资建议。用户与作者之间的任何争议,与本平台无关。如网页中刊载的文章或图片涉及侵权,请提供相关的权利证明和身份证明发送邮件到support@aicoin.com,本平台相关工作人员将会进行核查。


