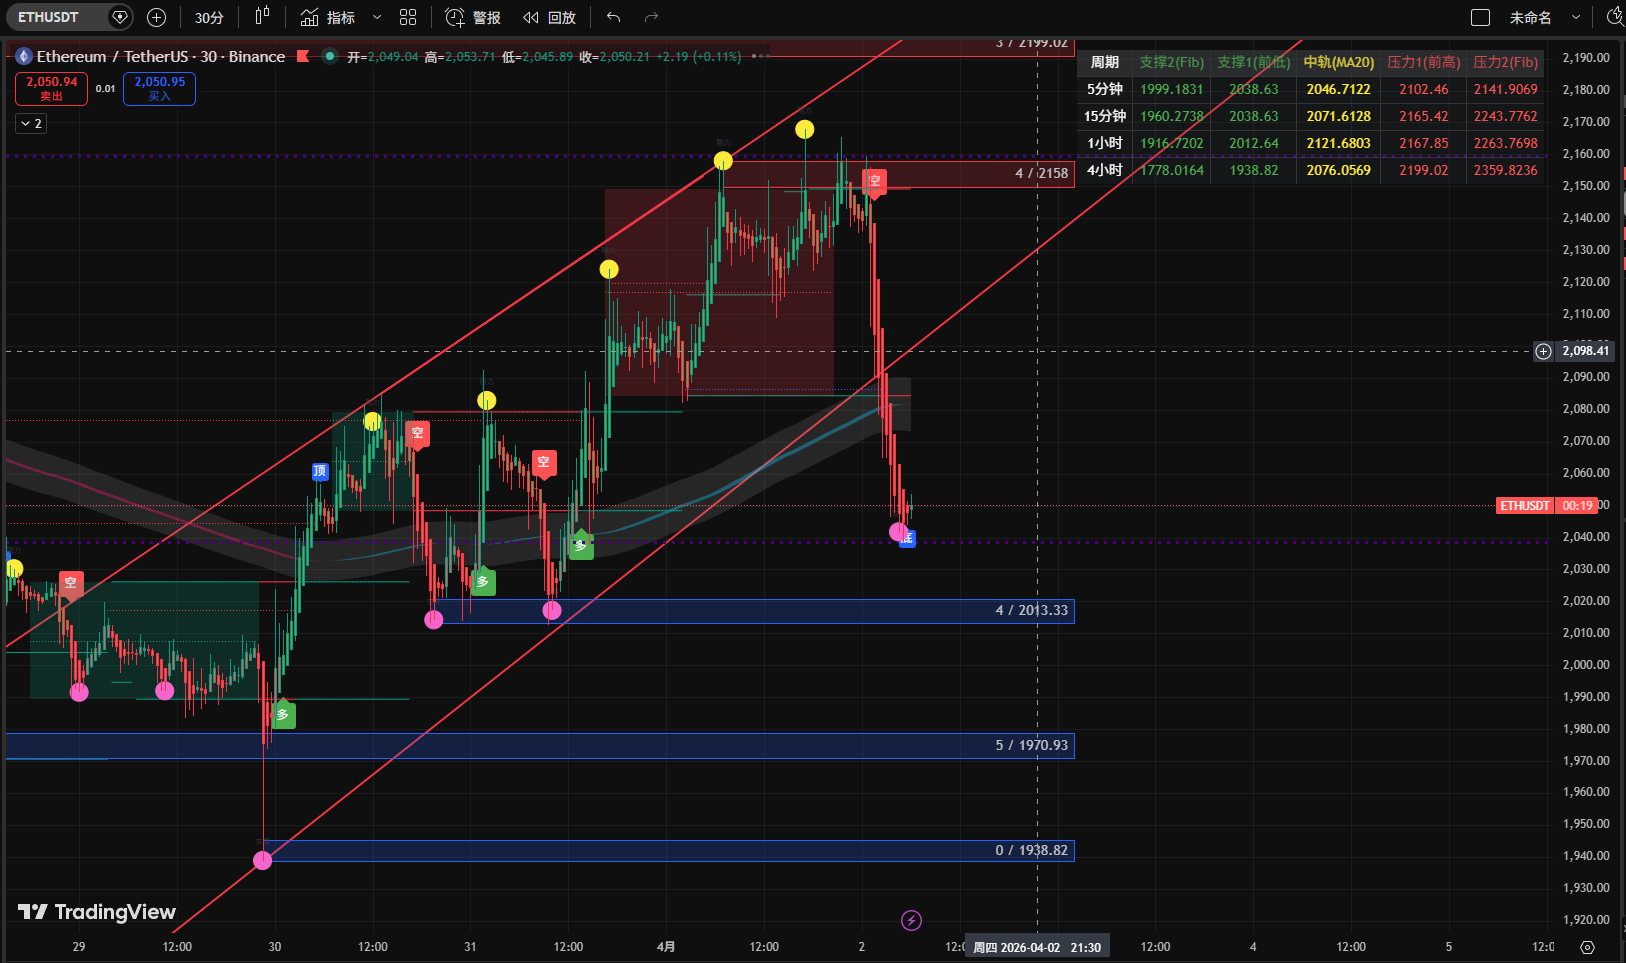
Operation Direction: Bet on Short-term Correction and Rebound
Bullish Plan: Use the TD9 signal to enter a light long position around 2030 - 2050 (betting on the rebound).
Stop Loss: 1980 (if it breaks this round number, the pattern will be completely damaged).
Take Profit: Reduce positions in the 2100 - 2120 area.
Strategy: Since there is already a TD9 signal, it is recommended to hold on for now and observe whether the price can stabilize at 2080.
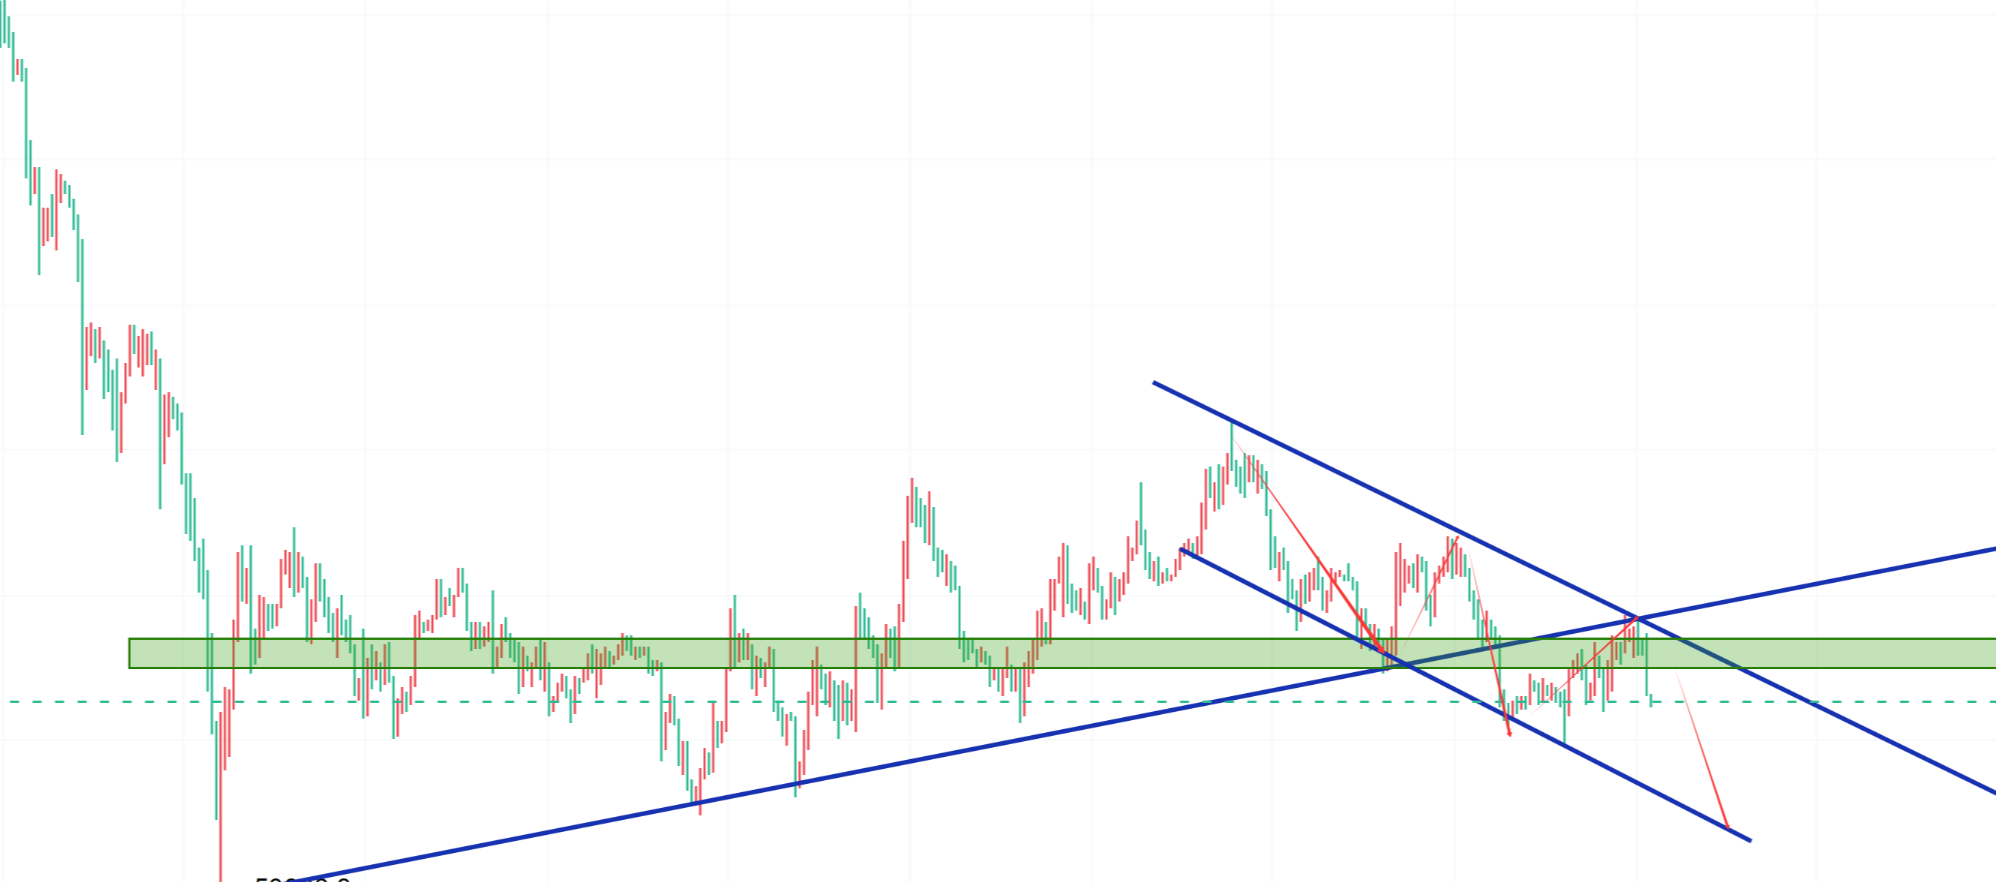
Additional Buy: Only consider adding positions to the right side after stabilizing at 2120 (recovering the downward trend shown in the chart).
Key Positions
Resistance: 2100 (round number and dense selling pressure area), 2166 (previous peak resistance).
Support: 2000 (core psychological support), 1937 (previous low pin position shown in the chart).
Risk Warning and Response
Pin Risk: Pay attention to liquidity near 1937. If the rebound is weak, the main force may once again pin down to clear leverages, make sure to set hard stop losses.
Correlation Risk: ETH is currently underperforming compared to BTC. If BTC cannot stabilize at 67000, ETH's TD9 rebound is likely to fail and test the bottom again.
Technical analysis shows TD9 oversold rebound signal, short-term bullish to around 2100, but the overall trend has not yet reversed, it is recommended to focus on short-term bullish bets or reduce positions on rallies.
News Aspect
Improvement in Macroeconomic Expectations: As expectations grow for the Trump administration to accelerate the end of regional conflicts, market risk aversion significantly eases. As a high-elasticity asset, ETH's rebound strength usually surpasses BTC during sentiment recovery.
On-Chain Data: In the past 24 hours, ETH on-chain activity has risen. Some whales have shown obvious support behavior in the 2000 - 2050 range.
Starting Pressure in Q2: The overall performance of the crypto market in Q1 2026 has been at weaker levels in recent years, and institutions are skeptical of the rebound's height in early April. The market still lacks large-scale incremental funds.
The news sentiment is mildly bullish but has not yet formed a strong reversal force, currently in the "emotion-driven rebound repair period".
Technical Aspect
Current Price: About 2050
TD Indicator: The chart clearly shows a TD9 (red) bottom signal, which typically indicates short-term exhaustion after consecutive declines, with a strong rebound demand.
Moving Averages
MA24 (2056): This is the current primary resistance level, and the price is attempting to recover it.
MA120 (2014): The price has currently pulled back and is testing the effectiveness of this long-term support level.
Alligator: The three lines are starting to converge, showing a slowdown in the downtrend, possibly entering a sideways or slight rebound phase.

免责声明:本文章仅代表作者个人观点,不代表本平台的立场和观点。本文章仅供信息分享,不构成对任何人的任何投资建议。用户与作者之间的任何争议,与本平台无关。如网页中刊载的文章或图片涉及侵权,请提供相关的权利证明和身份证明发送邮件到support@aicoin.com,本平台相关工作人员将会进行核查。