Cryptocurrency Circle Academician: The long attack of Ethereum begins on April 1! The professional trading system shows its power again! Latest market analysis and thought reference
The current price of Ethereum is 2095. The market yesterday perfectly validated our judgment: the north moves to take profit at 2100, while the south moves down to stop loss at 2100 as planned. Dual-track operation, making profits within cognition and controlling losses. The market is always full of opportunities; what it lacks are traders who strictly execute discipline. From the market view, the price repeatedly grapples between the range of 2000 to 2100, with fierce tug-of-war between long and short positions. Only by having a plan in advance and strictly implementing stop losses and take profits can one steadily navigate through a volatile market, not being swayed by emotions or being harvested by the market.
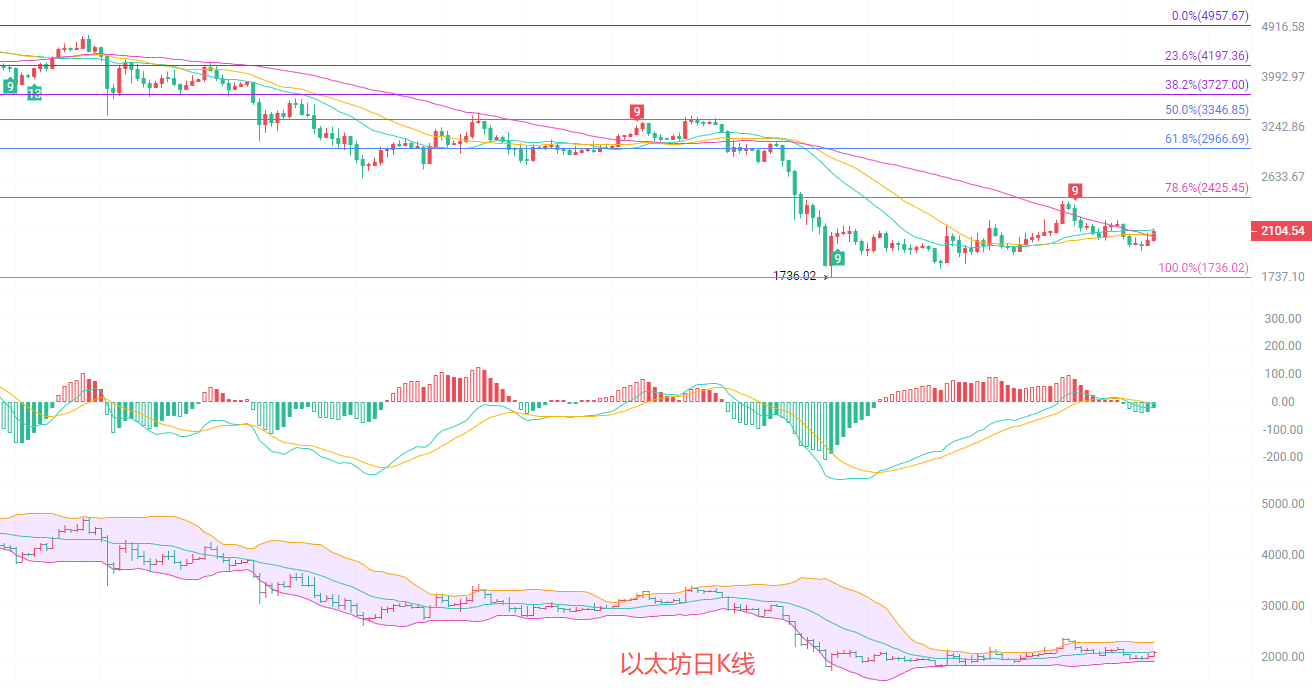
The daily K-line currently shows 2097, a rise of 3.53%, stabilizing under the MA20 line at 2117. The MA30 line at 2083 and the MA60 line at 2059 form support. The MACD indicator's green bars continuously shorten, with significant reduction in southward momentum, and a clear signal for a northward counterattack. The Fibonacci 0.786 position at 2425 serves as a strong resistance in the medium term, while the lower level at 1736 is a historical strong support. Overall, it is in the phase of consolidating a bottom and recovering from a pullback, with the trend gradually shifting from south to north, ending the southward trend, and entering a rebound cycle of fluctuating upward. Future challenges are expected at the 2200 level.
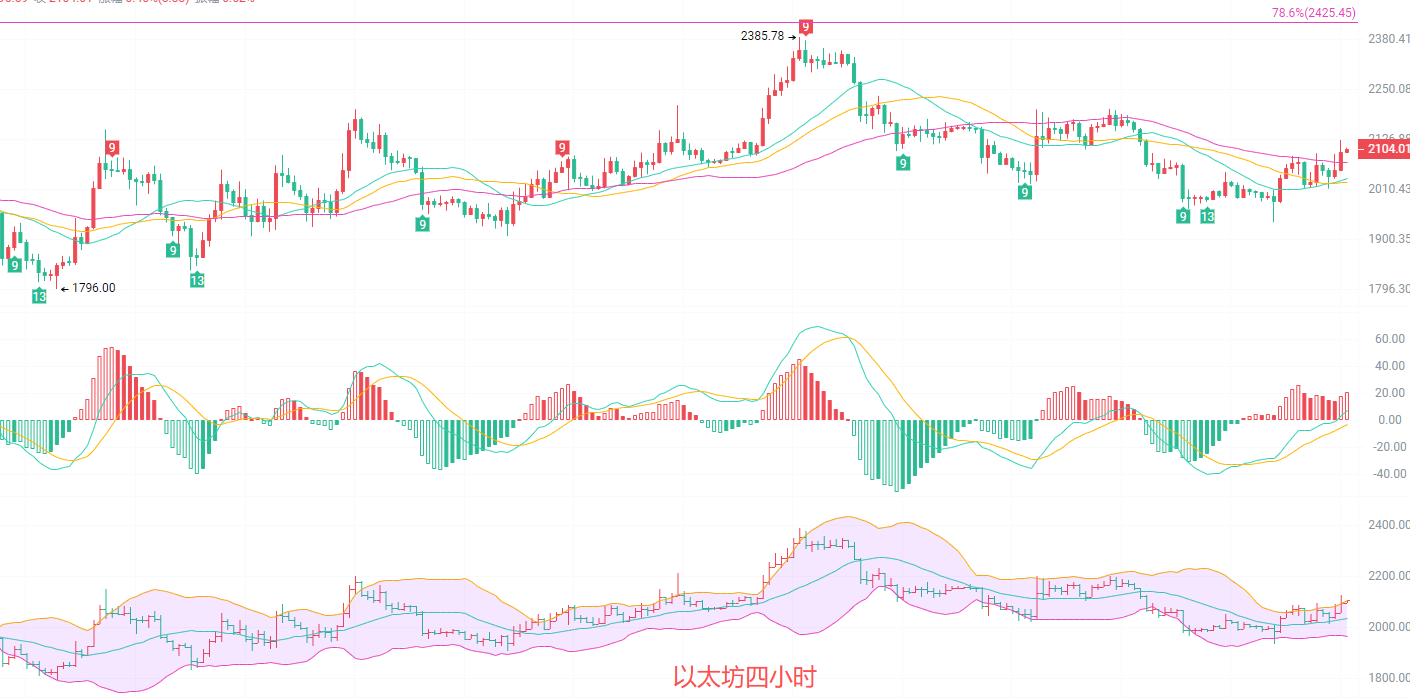
The price on the four-hour chart has broken through the MA20 line at 2031 and the MA30 line at 2025, stabilizing above the MA60 line at 2072, with short-term moving averages aligned upward. The MACD indicator forms a golden cross with red bars continuing to expand, showing strong momentum northward. The middle band of the Bollinger Bands at 2031 provides strong support, and the upper band at 2094 has been breached, with the price running above the upper band. The short-term trend is clearly bullish, and the rebound continues. Our southward approach needs to shift to a northward one.
Short-term reference: (practical data has been updated; for details, consult the author)
Sell south from 2180 to 2200, with a stop loss at 2210, aiming for a target of 2120 with a fast in and out approach.
Buy north from 2085 to 2075, with a stop loss at 2050, targeting 2150 to 2200, and aiming for 2250 if the position is broken.
Specific operations should be based on real-time market data. For more information, consult the author. The article may have delays in publication, and it is advised for reference only at your own risk.

Warm tip: The above content is solely created by the author’s public account. Advertisements at the end of the article and in the comments section are unrelated to the author. Please discern carefully, thank you for reading.
免责声明:本文章仅代表作者个人观点,不代表本平台的立场和观点。本文章仅供信息分享,不构成对任何人的任何投资建议。用户与作者之间的任何争议,与本平台无关。如网页中刊载的文章或图片涉及侵权,请提供相关的权利证明和身份证明发送邮件到support@aicoin.com,本平台相关工作人员将会进行核查。