Summary
In the first quarter of 2026, the cryptocurrency market experienced a historic deleveraging storm. Bitcoin fell over 40% from its high, Ethereum dropped deeper, and altcoins generally halved in value. This round of plummeting was not simply due to a cooling market sentiment or regulatory rumors; it was triggered by the resonance of three tightening liquidity factors: large-scale unwinding of yen carry trades, the U.S. Treasury's TGA account reconstruction withdrawing market funds, and systematic increases in margin requirements within the derivatives market. The combination of these factors, along with the high-leverage structure and valuation bubble of the cryptocurrency market itself, triggered a cascading clearing. Looking ahead, the cryptocurrency market has bid farewell to the rough rising stage driven by "excess liquidity" and has entered a new normal dominated by macro factors. Amid uncertainties in the Federal Reserve's policy path and the contraction of global central banks' balance sheets, crypto assets will face ongoing repricing pressure.
1. The Historic High Valuation of U.S. Stocks: The "Ceiling Effect" of Pricing Risk Assets
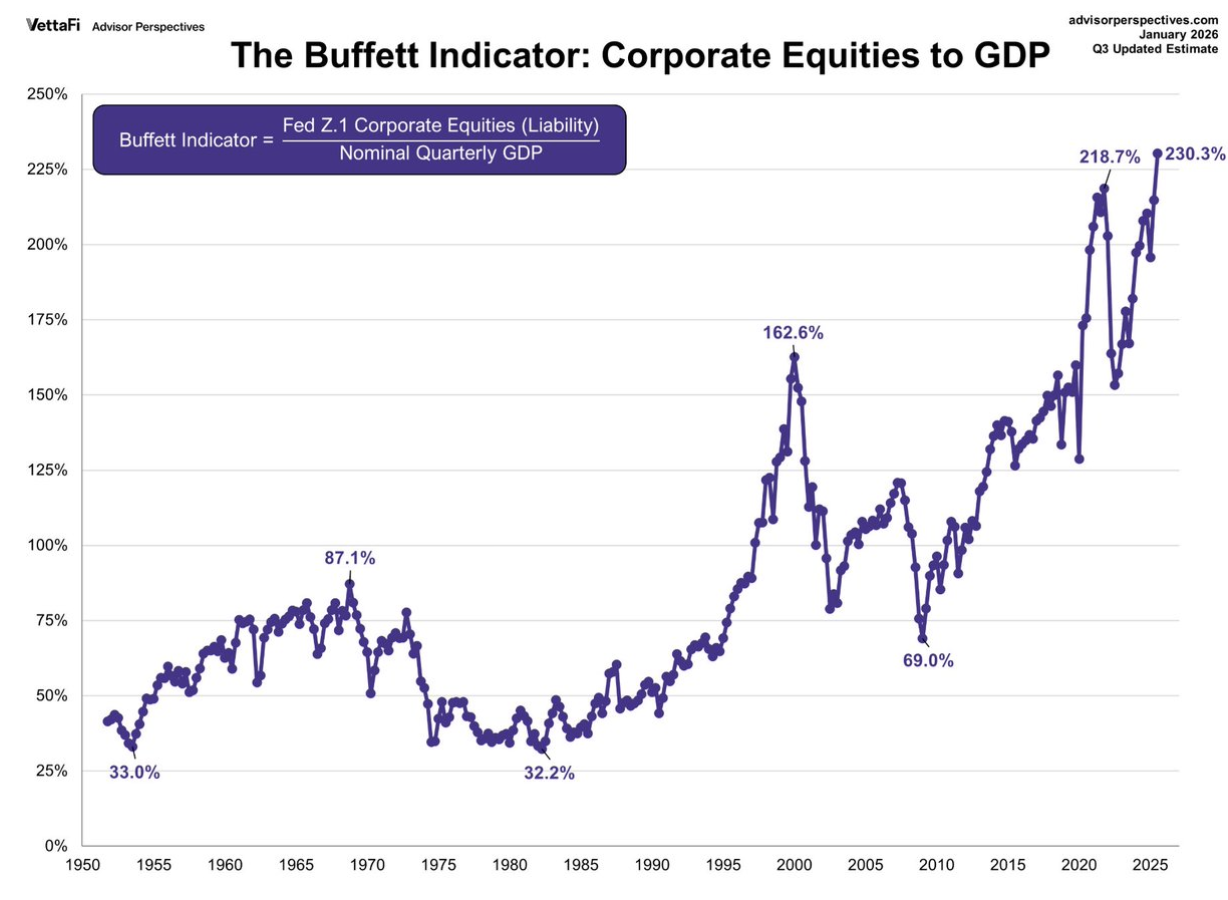
When analyzing the trends in the cryptocurrency market, an important macro background is that the valuation of U.S. stocks is at historic high levels. As the "pricing anchor" for global risk assets, the valuation level of U.S. stocks not only reflects market expectations for American corporate profits but also profoundly influences the valuation ceiling of the cryptocurrency market through channels such as asset price effect, investor risk preference, and global capital flows. Multiple indicators confirm the current overvaluation of U.S. stocks. The Buffett Indicator shows that the ratio of total market capitalization to GDP has climbed to 230%, a historic extreme, far surpassing the levels before the internet bubble in 2000 and the financial crisis in 2007. The 12-month forward P/E ratio of the S&P 500 is 22.0 times, significantly higher than the 30-year historical average of 17.1 times, nearing the 25.2 time of the internet bubble era. The Shiller cyclically adjusted P/E ratio is about 38 times, second only to the 44 times in 2000. The price-to-sales ratio has surpassed 3.0 times, setting a new historical high. These indicators collectively point to a conclusion: U.S. stocks are in a significantly overvalued range.
The high valuation of U.S. stocks transmits through various mechanisms to the cryptocurrency market. From the perspective of asset price effects, when U.S. stock valuations are at historic highs, it means future expected returns are declining. Rational investors will reassess the allocation ratios of all risk assets, and cryptocurrency assets, as higher volatility "marginal risk assets," are often cut first. From the standpoint of Federal Reserve policy constraints, the high valuations of U.S. stocks put the Fed in a dilemma, limiting its scope for easing, which may keep a hawkish stance for a longer time than the market expects, exerting pressure on all risk assets. From the viewpoint of profit-taking, after years of rising, institutional investors are generally overweighting U.S. stocks, and when valuations reach extreme levels, they will systematically reduce risk exposure, often expressed through selling the assets that have risen the most and have the best liquidity — including Bitcoin. From the perspective of risk sentiment, as the global risk asset barometer, the high valuation of U.S. stocks can trigger investor caution towards all assets that have risen excessively and are difficult to quantify, making cryptocurrency assets most likely to be discarded.
Historically, every time valuations reached the current level, it ultimately ended in painful mean reversion. The lessons from 1929, 2000, and 2007 are vivid. The peculiarity of current U.S. stock valuations is that they are the direct product of the longest and largest experiment of loose monetary policy over the past 15 years. When these policies begin to exit and valuations are at historic highs, the process of reversion may be more intense than before. For the cryptocurrency market, this means that even if the fundamentals of the crypto industry continue to improve, the macro-level pressure on valuations will still be an important resistance in the next 1-2 years. Only when U.S. stock valuations are digested over time or adjusted back to reasonable ranges can the cryptocurrency market truly open a new healthy upward cycle.
2. Unwinding of Yen Carry Trades: The "Invisible Pump" of Global Liquidity
The reversal of yen carry trades is the trigger for this round of cryptocurrency market crash and is also the most critical macro driving force. For a long time, the zero-interest policy maintained by the Bank of Japan has made the yen the currency with the lowest global financing costs. International investors have borrowed massive amounts of yen, converted it into U.S. dollars or other high-yield currencies, and invested in global high-yield assets — including highly volatile cryptocurrencies.
In early 2026, the underlying logic of this arbitrage model began to shift. As inflationary pressures emerged in Japan, expectations for the Bank of Japan's exit from negative interest rate policies surged. Japanese government bond yields saw multiple sharp increases, with the yield on 10-year JGBs breaking above 1.2%, hitting a multi-year high. This change directly compressed the interest rate spread between the yen and the dollar: when costs for borrowing yen increased and the expected yield on dollar assets remained unchanged or even decreased, the attractiveness of carry trades dropped sharply.
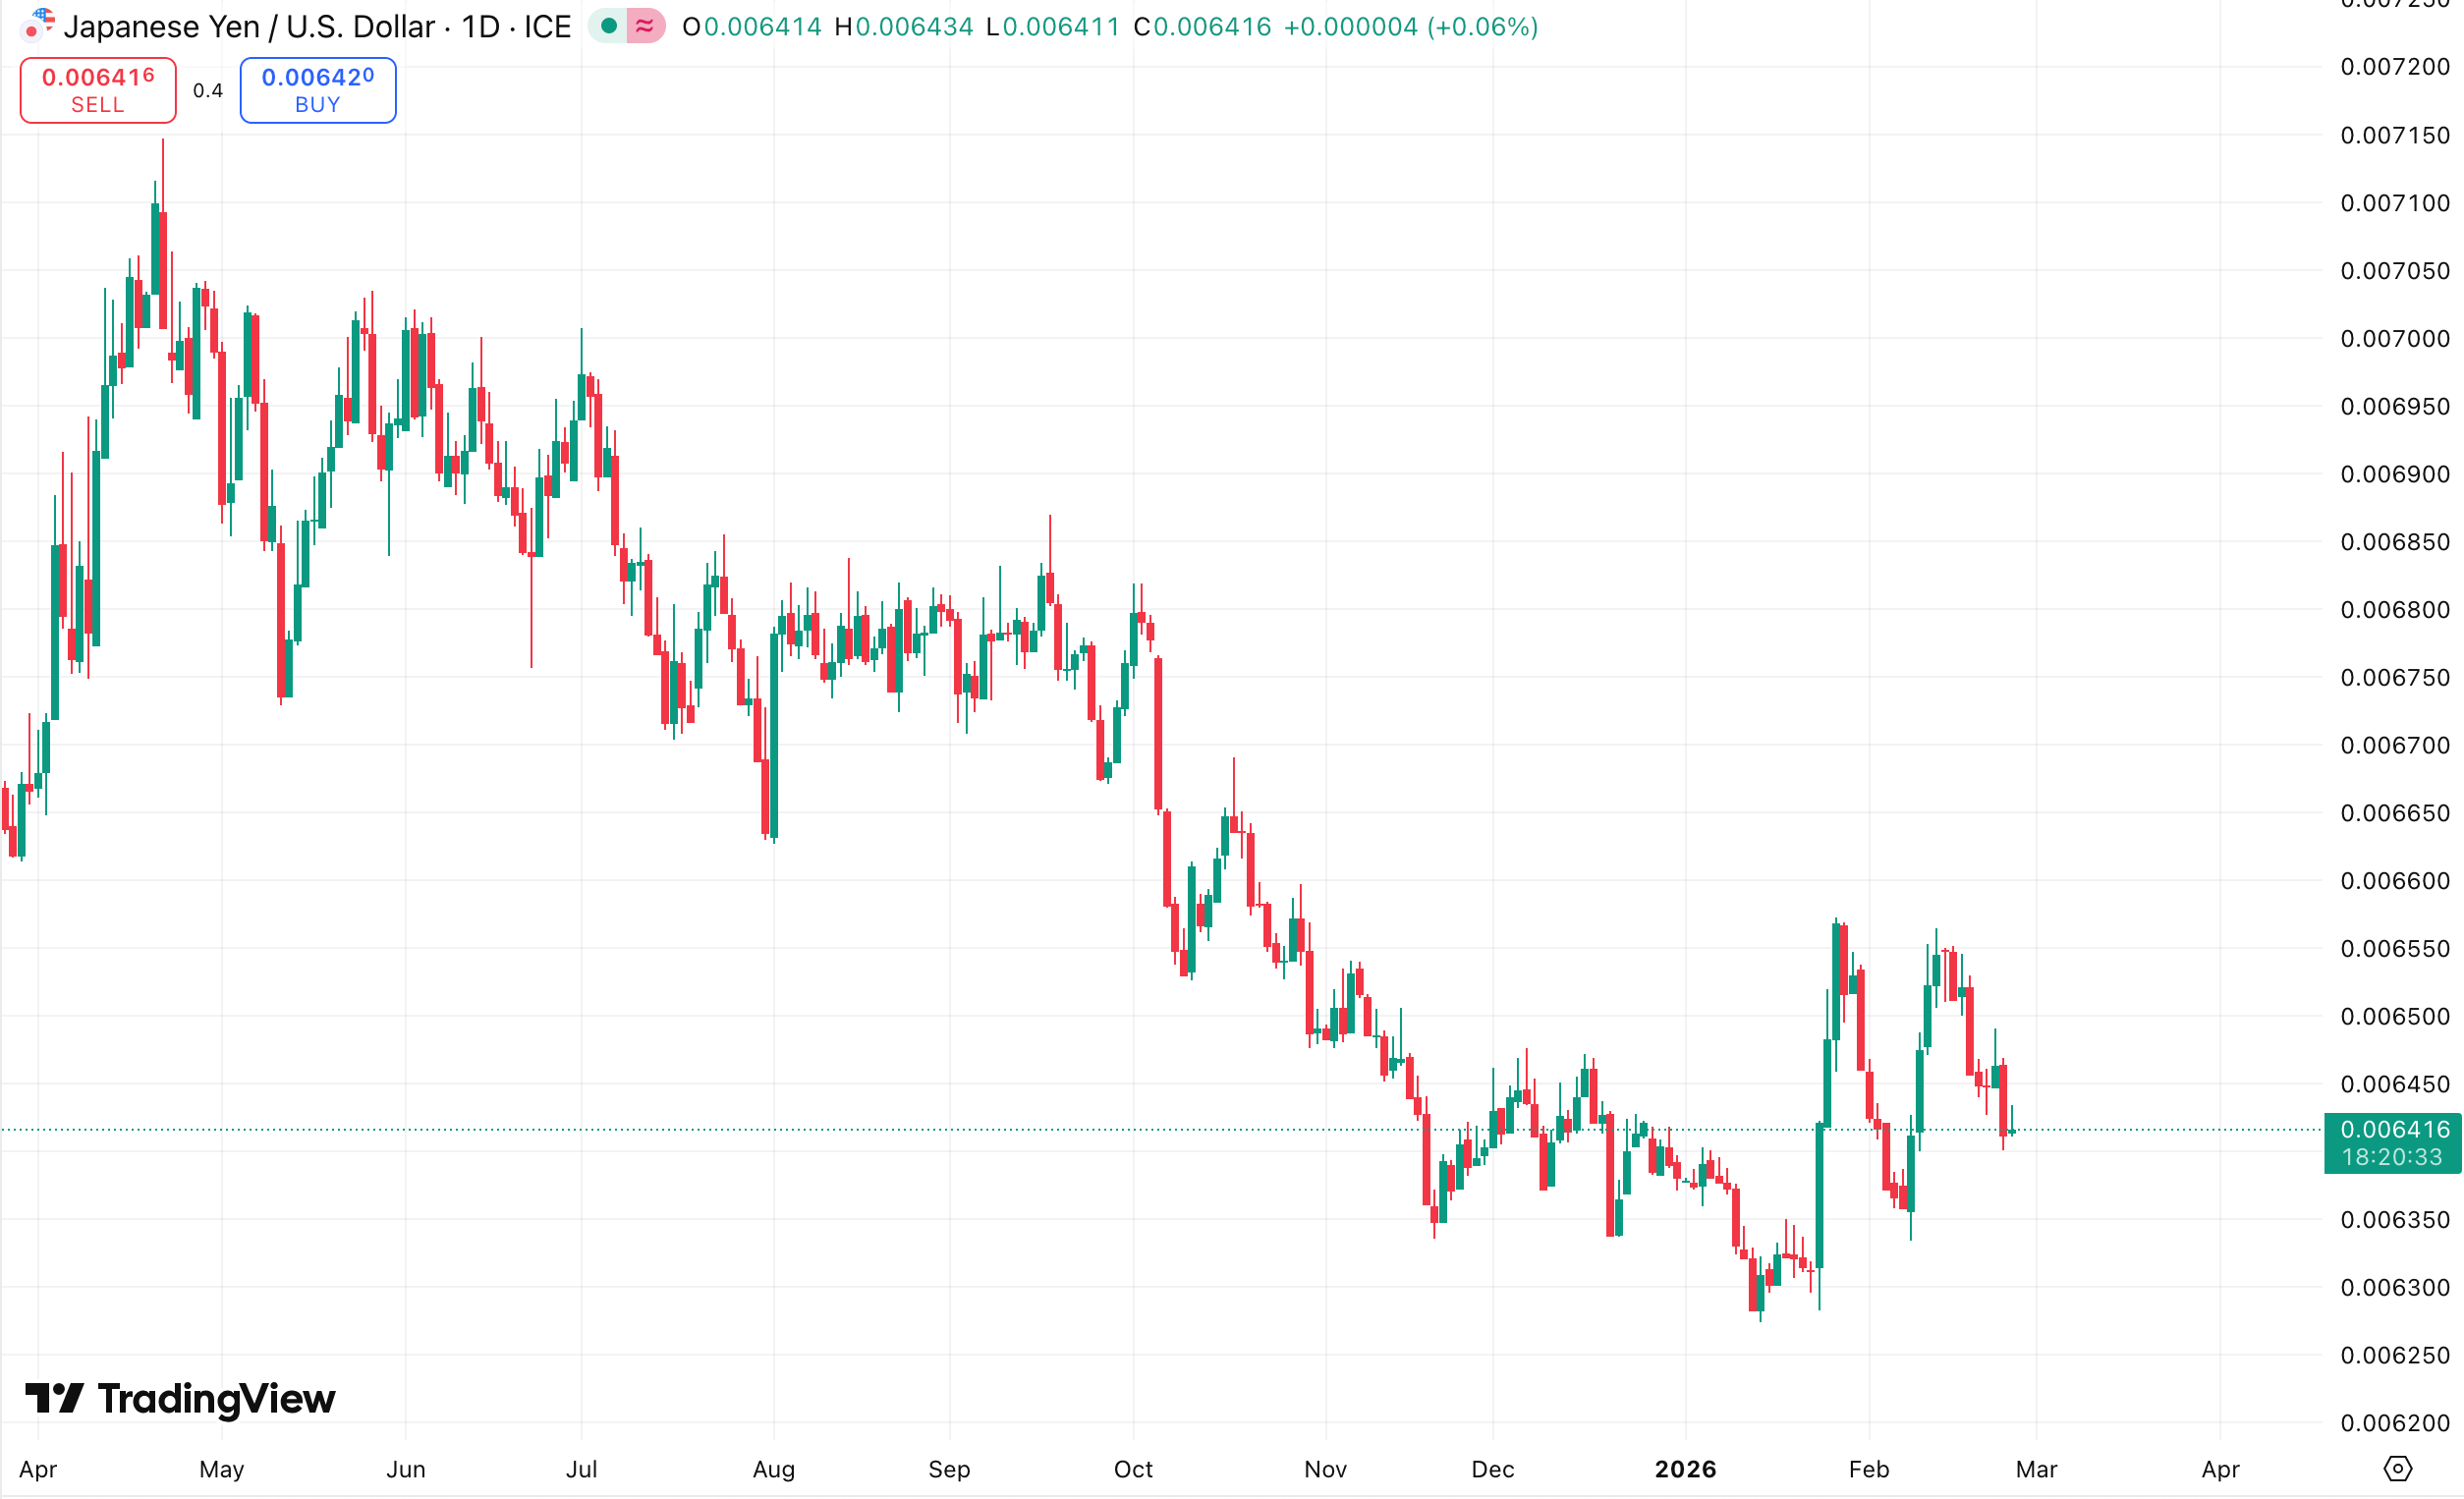
More severely, when the yen began to appreciate (the USD/JPY exchange rate fell from above 150 to around 140), carry traders faced not only narrower interest spreads but also exchange rate losses. In such cases, the most rational choice is to unwind: selling previously held overseas assets (including Bitcoin, Ethereum, and other crypto assets) to buy back yen to repay loans. The cryptocurrency market's unique 24/7 trading and high liquidity made it the "cash machine" that arbitrage traders sold off first. Data clearly shows that during several trading days in mid-February when the yen rapidly appreciated, Bitcoin's exchange rate against the yen showed a high negative correlation, a typical characteristic of unwinding trades.
It is noteworthy that the scale of yen carry trades is estimated to be in the trillions of dollars, and the unwinding process often exhibits persistence. As long as the yen/dollar interest spread does not widen again and the trend of yen appreciation does not reverse, this "pump" will continue to extract funds from the global risk asset markets. For the cryptocurrency market, which relies on incremental capital, this is undoubtedly a critical blow.
3. TGA Account Reconstruction and Treasury Issuance: The Liquidity Siphon of Fiscal Policy
If yen carry trades represent a tightening of liquidity at the international level, then the changes in the balance of the U.S. Treasury General Account (TGA) are a direct siphoning of cash within the dollar system. The TGA account is essentially the Treasury's "wallet": when the Treasury increases the TGA balance through issuing treasury bonds or collecting taxes, it means money is flowing from the commercial banking system into the Treasury account, causing bank reserves to decrease and market liquidity to tighten; conversely, when the Treasury spends (such as paying government contracts, social security, etc.), money flows back into the market, increasing liquidity.
From February to March 2026, the market was facing a rapid reconstruction period of the TGA balance. According to the U.S. Treasury's financing plan, the TGA balance target was maintained at $850 billion by the end of March, with a peak during the April tax season expected to reach about $1.025 trillion. This means that in just two months, the Treasury plans to siphon nearly $200 billion from the financial system. Meanwhile, to supplement the TGA and finance the fiscal deficit, the Treasury announced a large-scale quarterly refinancing plan in early February, with the issuance of treasury bonds exceeding market expectations.
This "bond issuance + TGA balance increase" operation directly led to the continuous decline of bank reserves. For the cryptocurrency market, its transmission mechanism is more indirect but equally lethal: decreased bank reserves → financial institutions tighten credit → hedge funds and market makers' financing ability declines → risk exposure is forced to compress → cryptocurrency assets face reductions. The reserve assets of stablecoin issuers are primarily U.S. treasury bonds, and the TGA reconstruction has led to increased volatility in treasury yields, also indirectly affecting the redemption pressure and liquidity support of stablecoins.
Historically, drastic changes in the TGA balance are often highly correlated with risk asset price trends. In early 2021, when the TGA balance rapidly decreased (fiscal spending), Bitcoin迎来了牛市高潮;而2026年初的TGA重建过程,则对应着加密市场的持续阴跌和最终崩盘。这并非巧合,而是流动性周期的必然映射。
4. Margin Increases and De-leveraging in Derivatives: Forced Liquidation at the Exchange Level
In addition to macro-level liquidity tightening, the inherent fragility of the cryptocurrency market's derivatives structure is also an important amplifier of the crash. In early February, as extreme volatility emerged in the gold, silver and other precious metal markets, the Chicago Mercantile Exchange (CME) continuously raised margin requirements for gold and silver futures. Although this move directly targeted the precious metal market, its ripple effects quickly transmitted to the cryptocurrency market.
First, the CME, as the world's most important derivatives exchange, sets an example with its margin adjustments. Various crypto trading exchanges' risk control departments, upon observing rising market volatility, have followed suit by increasing the margin ratios for perpetual contracts and futures and reducing leverage limits. This is equivalent to forced de-leveraging for the cryptocurrency market, which highly relies on leveraged trading. A large number of highly leveraged positions were forced to liquidate, triggering further price declines and subsequently triggering more liquidations, creating a negative spiral.
Secondly, there exists a common bullish group between the cryptocurrency market and the precious metals market — macro hedge funds and trend traders. When these institutions sustain losses in the precious metals market due to margin increases, they often need to sell other assets (including crypto assets) to replenish margins or offset losses, further exacerbating selling pressure across assets.
Furthermore, it is noteworthy that during this round of drastic decline, the futures premium for Bitcoin and Ethereum rapidly turned negative (discounts in forward prices), and the funding rates for perpetual contracts continued to be negative, indicating a market shift from being bull-dominated to bear-dominated. When funding rates remain negative for an extended period, it means that bulls not only endure losses from declining prices but also pay funding fees to bears, further weakening the bulls' willingness to hold positions and prolonging the time required for the market to find a bottom. Historical data shows that only when funding rates return to neutral or even positive and futures premiums recover can the market anticipate a true stabilization.
5. The Structure of the Cryptocurrency Market: The Dual Fragility of Overvaluation and Liquidity Dependence
Against the backdrop of macro liquidity tightening, the high overvaluation and high leverage characteristics of the cryptocurrency market amplified the intensity of the downturn. Although crypto assets lack traditional price-to-earnings (P/E) valuations, we can evaluate their valuation levels through multiple dimensions:
First is Bitcoin's market capitalization ratio. Before this round of decline, Bitcoin's market cap ratio fell below 40%, with massive amounts of capital flowing into various altcoins and DeFi tokens; this is a typical characteristic of the later stages of a bull market—capital chasing high-risk, high-reward tail assets rather than leading assets. When liquidity reverses, these high-beta assets are often the first to take the hit, with declines far exceeding those of Bitcoin.
Second is the total market capitalization change of stablecoins. Stablecoins are the "backup cash" of the cryptocurrency market, and changes in their total market cap reflect the willingness of outside capital to enter the market. Data shows that since January 2026, the total market cap of USDT and USDC has stagnated even slightly declined, indicating that the speed of new capital entering the market has not kept up with the demand for market expansion. When the market relies on existing funds and leverage to maintain high levels, any liquidity shock could lead to collapse.
Third is the divergence between on-chain activity and price. In the months leading up to the crash, despite Bitcoin prices remaining high, metrics such as the number of active addresses and transaction counts did not reach new highs and even showed declines. This indicates that price increases were primarily driven by leveraged trading within exchanges rather than real improvements in fundamentals or adoption rates. Leveraged-driven rises often come quickly and go just as fast; once funds tighten, prices will quickly revert.
The uniqueness of the cryptocurrency market lies in the sensitivity of its participants to macro liquidity compared to other asset classes. This is because the cryptocurrency market lacks traditional "endogenous cash flows," and its price is entirely determined by the willingness of marginal buyers to enter. When macro liquidity is abundant, these marginal buyers (predominantly high-risk seeking retail investors and hedge funds) have ample funds, driving price increases; when macro liquidity tightens, they are also the first funds to withdraw. This downturn vividly illustrates this mechanism.
6. Market Outlook: Repricing of Crypto Assets within the Framework of Liquidity Indicators
Looking forward, the trends in the cryptocurrency market will no longer be driven by a single factor but will enter a new phase dominated by macro factors. Investors need to establish an analytical framework centered on liquidity indicators, focusing on the following variables:
First is the path of the Federal Reserve's monetary policy. Although the market is concerned about the hawkish stance that may emerge after Warsh's appointment as Fed Chairman, it is even more important to observe actual economic data. If the labor market shows significant cooling and inflation continues to recede, the Fed's pace of tightening may be slower than expected. The CME FedWatch tool indicates that market expectations for interest rate cuts in 2026 have been significantly revised down, but this adjustment has already been partially factored in. The key lies in when the Fed will release a clear signal of a policy shift.
Second is the changes in the TGA balance and net liquidity. Investors should closely monitor the TGA balance data released weekly by the U.S. Treasury, as well as changes in the Fed's balance sheet and ON RRP balances. Net liquidity (total Fed assets - TGA - ON RRP) is the most direct indicator of available cash in the market. If net liquidity continues to decline, the cryptocurrency market will remain under pressure; conversely, if net liquidity bottoms and rebounds, it may welcome a phase of rebound.
Third is the evolution of yen carry trades. The USD/JPY exchange rate and the interest spread between U.S. and Japanese 2-year government bonds are two key observation points. If the trend of yen appreciation halts and the interest spread stabilizes or widens, the pressure to unwound trades will ease, which would be a positive signal for global risk assets including the cryptocurrency market. On the contrary, if the yen continues to appreciate, caution is warranted against further de-leveraging.
Finally, there are structural indicators within the cryptocurrency market itself. Whether the total market cap of stablecoins can recover growth, whether Bitcoin's market cap ratio stabilizes, and whether the funding rates for perpetual contracts turn positive are all important references for judging whether the market has bottomed out. From historical experience, only when funding rates remain sustained positively, futures premiums recover, and stablecoins flow back to exchanges does it indicate that market confidence is truly restored.
In terms of specific timing, the second quarter is usually a relatively tight liquidity period in the year (with TGA balance peaking during tax season), combined with the ongoing shrinking of the Fed's balance sheet; the cryptocurrency market may continue to experience a phase of turbulent bottom-seeking. A real turning point may need to wait until the second half of the year — when the TGA balance begins to decline, and market expectations of the Fed's policy path become clearer.
7. Conclusion: Bidding Farewell to Rough-Riding Gains and Welcoming the New Macro Normal
The crash of the cryptocurrency market in the first quarter of 2026 is a systematic deleveraging event driven by macro liquidity and amplified by the structure of the cryptocurrency market itself. It marks the end of the rough rising phase driven by liquidity easing since 2023, and the cryptocurrency market officially enters a new macro normal.
In this new normal, cryptocurrency assets will be profoundly influenced by macro variables such as global central banks' balance sheets, fiscal policies, and currency fluctuations, just like other risk assets. The narrative claiming that "the cryptocurrency market is desensitized from the macro environment" and "digital gold as a safe haven" has been debunked in this round of decline — when a real liquidity crisis hits, Bitcoin's drop is not smaller than that of tech stocks, with its correlation to the Nasdaq soaring to historical highs.
For investors, this necessitates building a broader macro perspective, rather than merely focusing on project fundamentals or technological progress. Liquidity indicators should become one of the core bases for investment decision-making: focusing on changes in net liquidity, whether SOFR rates are abnormally rising, whether the MOVE volatility index for U.S. treasuries is climbing, and whether high-yield credit spreads are widening. These macro variables will determine the beta direction of the cryptocurrency market, while project fundamentals will only provide alpha opportunities after the beta is established.
Of course, new opportunities often arise after a crash. When leverage is cleared, speculators have exited, and valuations return to rationality, projects with true long-term value will welcome the opportunity to build positions. However, caution prevails until there is a clear turning point in the macro liquidity environment. For the cryptocurrency market, cash is the last scarce resource, and liquidity is the only truth.
免责声明:本文章仅代表作者个人观点,不代表本平台的立场和观点。本文章仅供信息分享,不构成对任何人的任何投资建议。用户与作者之间的任何争议,与本平台无关。如网页中刊载的文章或图片涉及侵权,请提供相关的权利证明和身份证明发送邮件到support@aicoin.com,本平台相关工作人员将会进行核查。


