比特币行情分析
1. 趋势分析
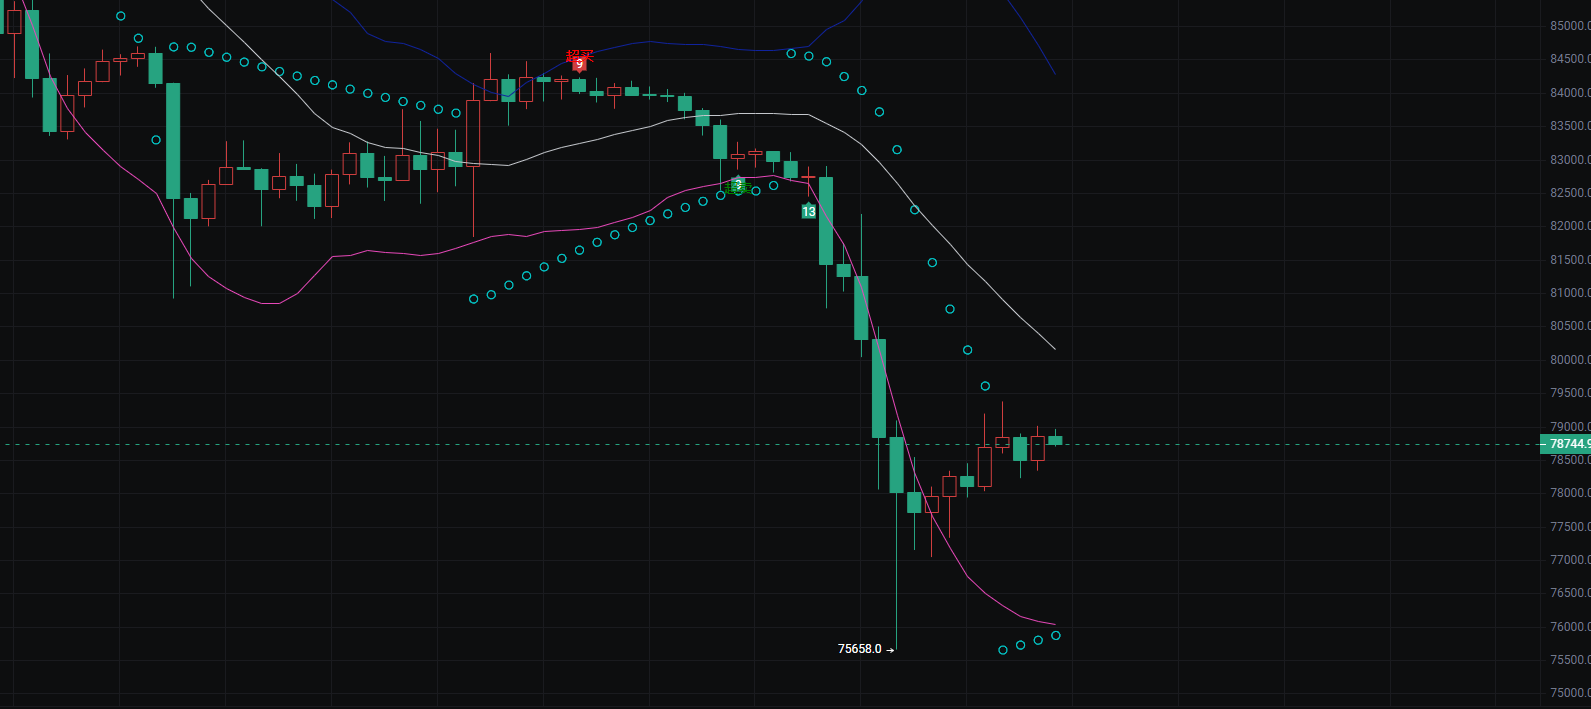
主趋势:这是一段非常明确的破位下跌趋势。价格从 85000 附近的高点持续下行,期间虽有小幅反弹,但整体高点和低点都在不断降低。
关键破位:价格先是跌破了白色和紫色的短期均线,随后直接向下击穿了下方的支撑区域,最低触及 75658 的低位,属于典型的放量急跌走势。
2. 关键信号
均线系统:三条均线(蓝、白、紫)均呈现向下拐头的状态,且价格在所有均线下方运行,说明短期、中期的多头力量已被空头主导。
支撑与反弹:在触及 75658 的低位后,价格出现了小阳线的反弹,当前在 78700 附近获得了短暂支撑。这是急跌后的技术性修复,但暂时还无法确认趋势反转。
量能特征:下跌过程中伴随长阴线,反映出空头抛压较重;而反弹阶段的 K 线实体较小,说明多头力量仍相对薄弱。
3. 后续推演
短期关注:重点观察 78500-79000 区间的支撑力度。如果价格能站稳并向上突破短期均线,可能会迎来一波反弹;但若再次跌破 75658 的低点,大概率会打开新的下行空间。
中期策略:在趋势未明确反转前,建议以观望或逢高做空为主。只有当价格重新站上所有均线,且出现明确的筑底信号(如双底、阳包阴等)时,再考虑布局多单。
关键支撑位
第一支撑:78500-78700(当前价格运行区间,是急跌后的短期多空争夺点)
第二支撑:75658(近期最低点,若跌破则打开新的下行空间)
极端支撑:75000(整数关口心理支撑位)
🎯 关键阻力位
第一阻力:79500-80000(短期均线压制位,也是前期密集成交区)
第二阻力:81000-81500(前期平台下沿,若能突破则反弹力度增强)
第三阻力:83000-83500(中期均线压力位,趋势反转的关键关口)
📊 均线拐点观察
紫色短期均线:目前处于向下拐头状态,若价格站上该均线且均线走平,是短期转强的信号。
白色中期均线:持续向下压制,需关注其斜率是否放缓。
蓝色长期均线:仍在高位向下,代表中期趋势尚未扭转。
以太坊行情分析
1. 趋势判断
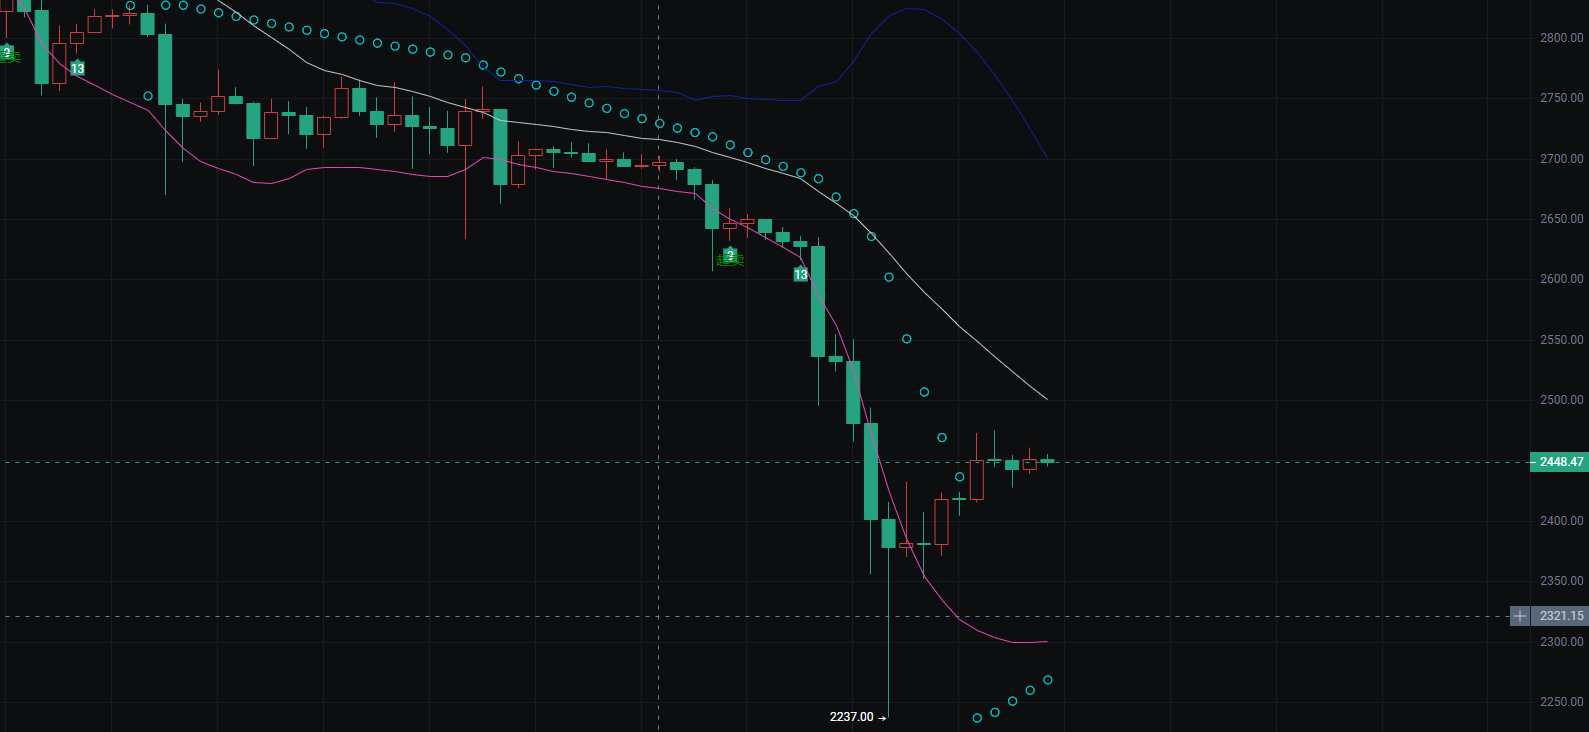
这是一段单边急跌后的企稳反弹走势。价格从接近 28500 的高点一路下行,最低触及 22370 的低位,随后出现了连续小阳线的反弹,目前在 24450 附近震荡整理。
2. 关键信号解析
均线状态:紫色短期均线仍在向下拐头,但斜率已明显放缓;白色中期均线和蓝色长期均线则继续向下压制,说明中期趋势仍未扭转。
支撑与阻力:
支撑位:24000(当前震荡区间下沿,也是急跌后的首个重要支撑)、22370(近期最低点,若跌破将确认二次探底)
阻力位:25000(整数关口 + 短期均线压制位)、26000(前期平台下沿,是反弹能否延续的关键)
量能与形态:下跌过程中伴随长阴线,抛压释放充分;反弹阶段 K 线实体较小且多为阳线,属于技术性修复,多头力量仍在积蓄中。
3. 后续推演
短期走势:若价格能站稳 24000 并向上突破 25000,反弹有望延续至 26000 附近;若跌破 24000,则可能回踩 22370 的低点确认支撑。
中期策略:在价格未有效站上 25000 前,建议以轻仓试多或观望为主;若突破 25000 并站稳,可逐步加仓,同时将止损设置在 22370 下方以控制风险。
🎯 关键支撑位
第一支撑:24000-24200(当前震荡区间下沿,是多空短期争夺的核心位置)
第二支撑:22370(近期最低点,若跌破则确认二次探底,打开新的下行空间)
极端支撑:22000(整数关口,心理支撑位)
🎯 关键阻力位
第一阻力:24800-25000(短期均线压制位,也是整数关口)
第二阻力:25800-26000(前期平台下沿,是反弹能否延续的关键关口)
第三阻力:27000-27200(中期均线压力位,趋势反转的重要标志)
📊 均线拐点观察
紫色短期均线:目前向下拐头但斜率放缓,若价格站上该均线且均线走平,是短期转强信号。
白色中期均线:持续向下压制,需关注其斜率是否由陡变缓。
蓝色长期均线:仍在高位向下,代表中期空头趋势尚未扭转。

(注:📣 由于公开平台的信息时效性和深度有限,市场瞬息万变,关键拐点、精准操作策略、突发风险提示,等内容需在(公众号号——比特熊)第一时间同步。在这里,你能获得: 实时策略推送,深度分析支持、互动答疑,针对个人持仓提供风险预警和优化建议。 🚨 谨记:市场永远奖励行动更快、信息更准的人!做少数派的赢家。)
免责声明:本文章仅代表作者个人观点,不代表本平台的立场和观点。本文章仅供信息分享,不构成对任何人的任何投资建议。用户与作者之间的任何争议,与本平台无关。如网页中刊载的文章或图片涉及侵权,请提供相关的权利证明和身份证明发送邮件到support@aicoin.com,本平台相关工作人员将会进行核查。