
作者:Cathie Wood
编译:哔哔News
本文不作为投资建议。请读者严格遵守当地法律法规。
划重点:ARK创始人Cathie Wood在这篇2026年新年展望 中指出,AI、机器人、区块链等技术正推动资本支出创新高,同时通胀回落、生产率提升,长期有望推动GDP增长。文章还分析了黄金、比特币、美元走势及市场估值,为投资者提供宏观与科技结合的参考视角。
祝ARK的投资者以及所有支持者新年快乐!
我们由衷感谢你们一直以来的支持。
正如我在这封信中所展示的,我们确实认为,投资者有充分的理由保持乐观!希望你能享受接下来的讨论。从经济史的角度来看,我们正站在一个重要的时间节点上。
被压紧的弹簧(COILED SPRING)
尽管过去三年美国实际国内生产总值(GDP)持续增长,但美国经济的内在结构却经历了一场“滚动式衰退”,逐渐演变成一根被压紧的弹簧,在未来几年中有可能强劲反弹。
为了应对与COVID相关的供给冲击,美联储在2022年3月至2023年7月的16个月内,将联邦基金利率从0.25%提高至5.5%,涨幅高达22倍。
这一史无前例的紧缩,推动住房、制造业、非AI资本开支,以及中低收入群体相继陷入衰退,如下图所示。
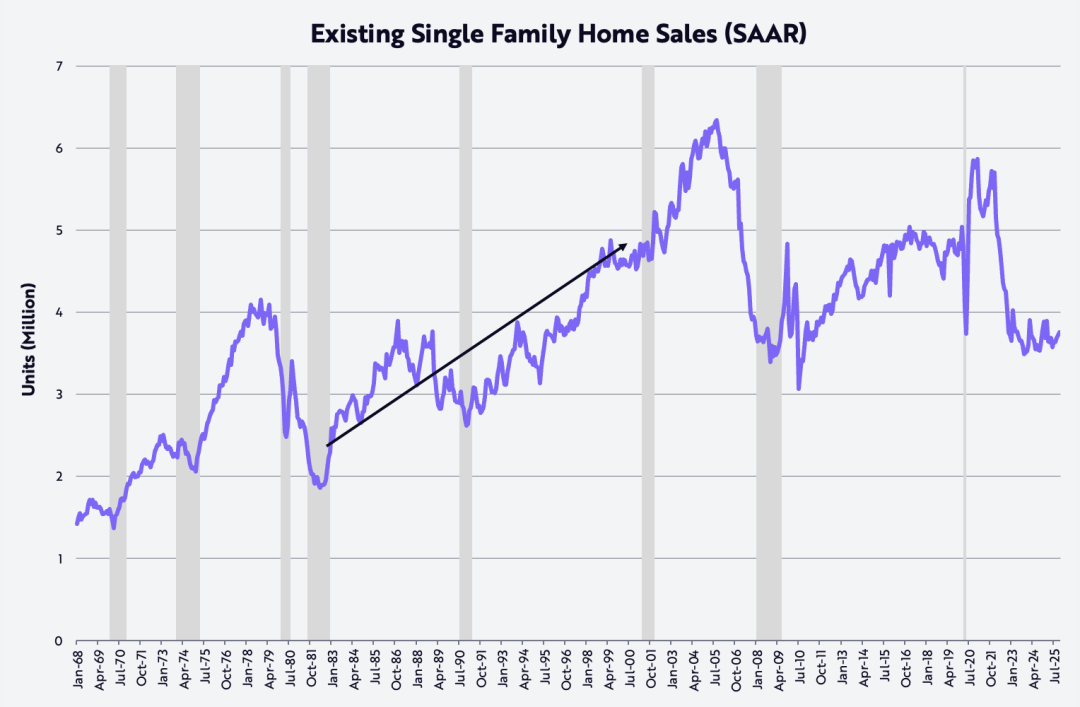
以成屋销售为例,美国住房市场从2021年1月年化590万套,下降至2023年10月的350万套,跌幅达40%。
这一水平上一次出现是在2010年11月,并且在过去两年中基本维持在这一低位附近。
更能说明“弹簧被压得多紧”的是:当前成屋销售量与20世纪80年代初相当,而当时美国人口规模比现在低约35%。
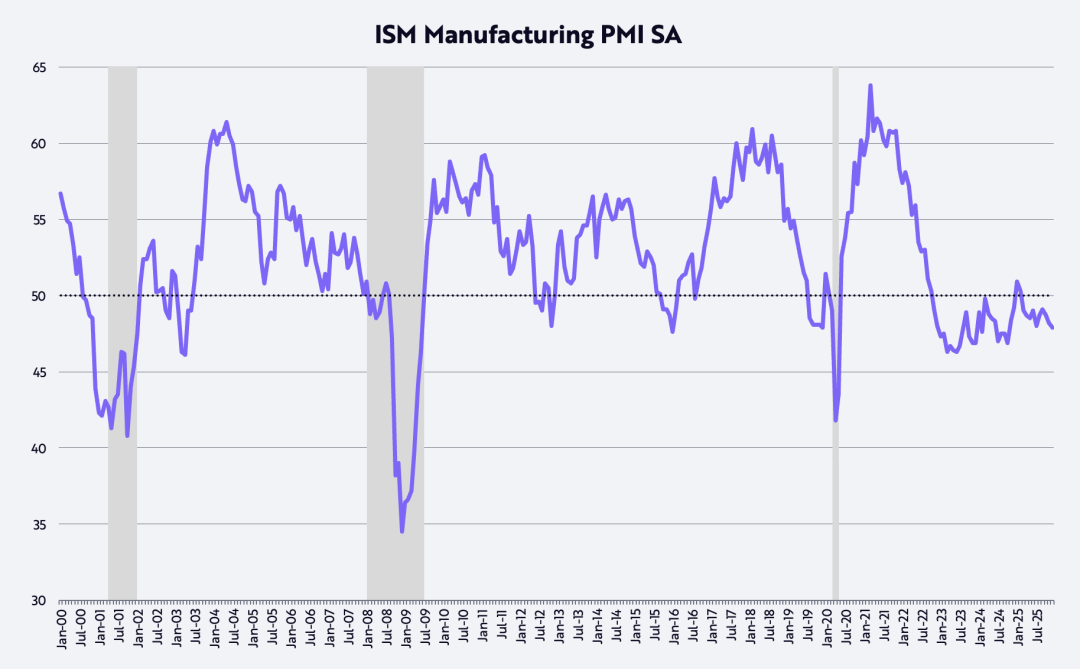
从美国采购经理人指数(PMI)来看,制造业已经连续约三年处于收缩状态。该扩散指数中,50是扩张与收缩的分界线,如下图所示。
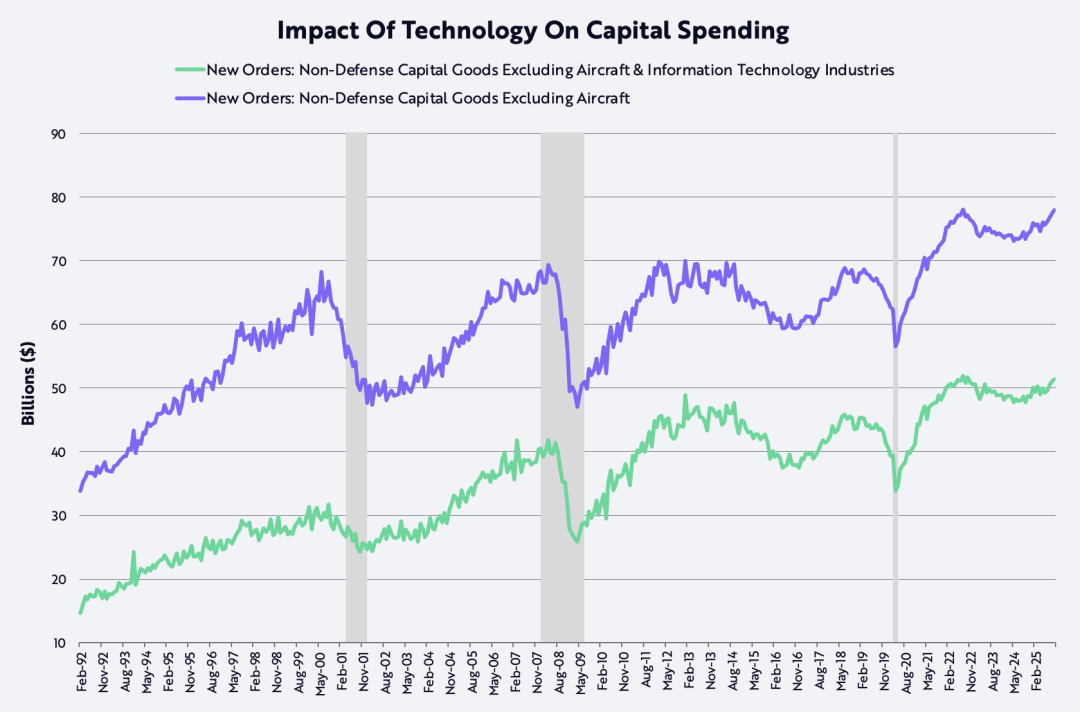
与此同时,以“非国防资本品(不含飞机)”衡量的资本支出在2022年中期达到峰值,随后回落,目前刚刚回到当时的水平,无论是否包含科技支出。
事实上,自90年代科技与电信泡沫破裂以来,这一资本支出指标在20多年里一直难以突破,直到2021年,COVID引发的供应冲击迫使数字化和实体投资同步上台阶。
曾经的“天花板”,如今看起来正在成为“地板”,因为AI、机器人、储能、区块链技术和多组学测序平台都已进入可大规模应用阶段。
在上世纪九十年代科技与电信泡沫之后,资本支出在大约700亿美元这一水平附近经历了长达20年的反复触顶过程;
而现在,这一阶段正在让位于可能成为历史上最强劲的一轮资本开支周期,如下图所示。
在我们看来,AI泡沫还在多年之后。
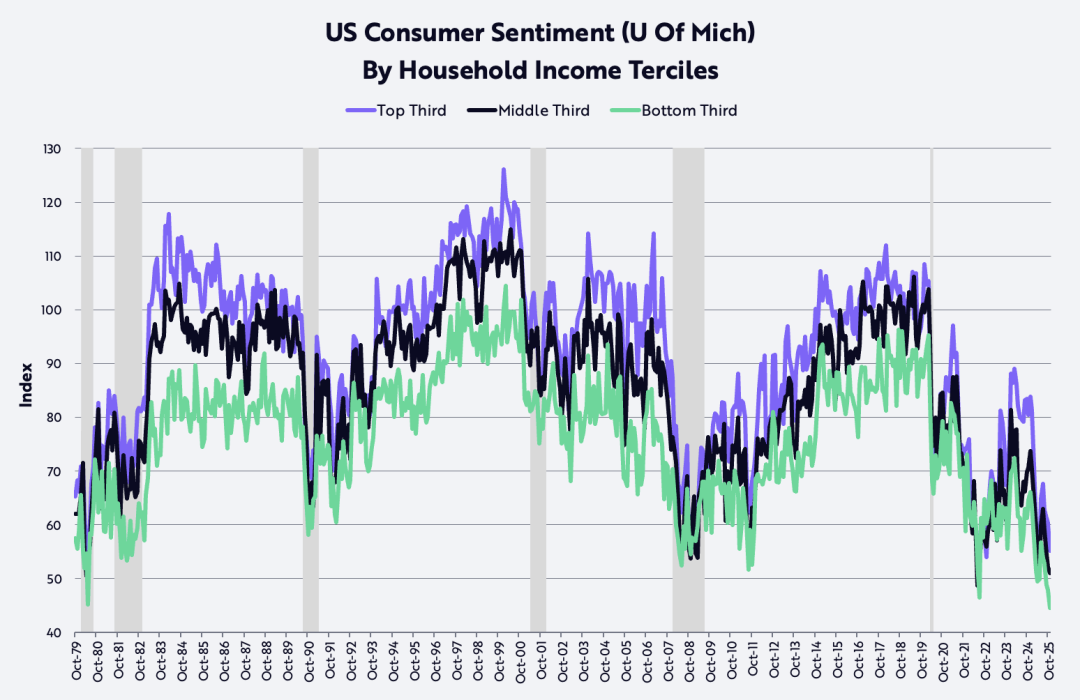
根据密歇根大学的数据,低收入和中等收入群体的消费者信心,已经低到上世纪80年代初的水平,当时两位数的通胀和利率严重侵蚀了购买力,并将美国经济拖入连续衰退。
更值得注意的是,近几个月,高收入群体的信心也出现明显下滑。我们认为,消费者信心是目前被压得最紧、最有可能反弹的那根弹簧之一。
去监管与低税收、低通胀、低利率
得益于去监管与减税(包括关税)、通胀下降以及利率下行的叠加效应,美国过去几年的滚动式衰退,有可能在未来一年及更长时间内迅速而剧烈地逆转。
去监管正在释放各行业的创新活力,其中以AI与数字资产领域为首,由首位“AI与加密货币事务负责人” David Sacks牵头。
与此同时,对小费、加班费和社保的减税,预计将在本季度为美国消费者带来可观的退税,使实际可支配收入增速从2025年下半年的年化约2%,跃升至本季度的约8.3%。
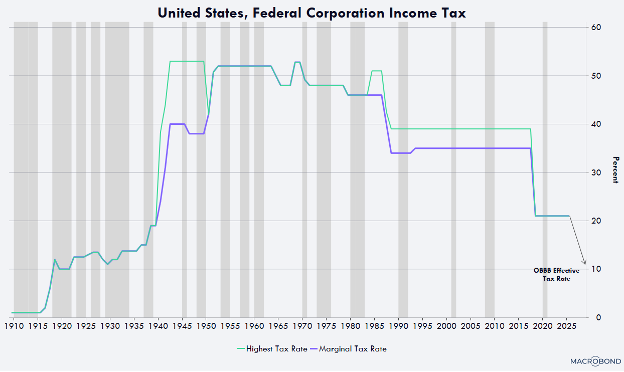
企业方面,制造设施、设备、软件和美国本土研发支出的加速折旧政策,将把有效企业税率压低至接近10%——这将是全球最低水平之一。
例如,任何在2028年年底之前于美国启动制造设施建设的企业,都可以在该建筑投入使用的第一年实现全额折旧,而不再需要像过去那样在30到40年内分期摊销。
设备、软件以及本土研发支出同样可以在第一年实现100%折旧。这一显著的现金流利好,已在去年的预算案中被永久化,并追溯适用于2025年1月1日。
在过去几年stubborn地维持在2%–3%区间后,CPI衡量的通胀,未来几年可能降至出人意料的低位,甚至不排除转负。
在过去几年里,以消费者价格指数(CPI)衡量的通胀顽固地徘徊在2%–3%区间;
但在未来几年内,通胀很可能下降到出人意料的低水平,甚至不排除转为负值。出现这一变化的原因有多方面,如下图所示。
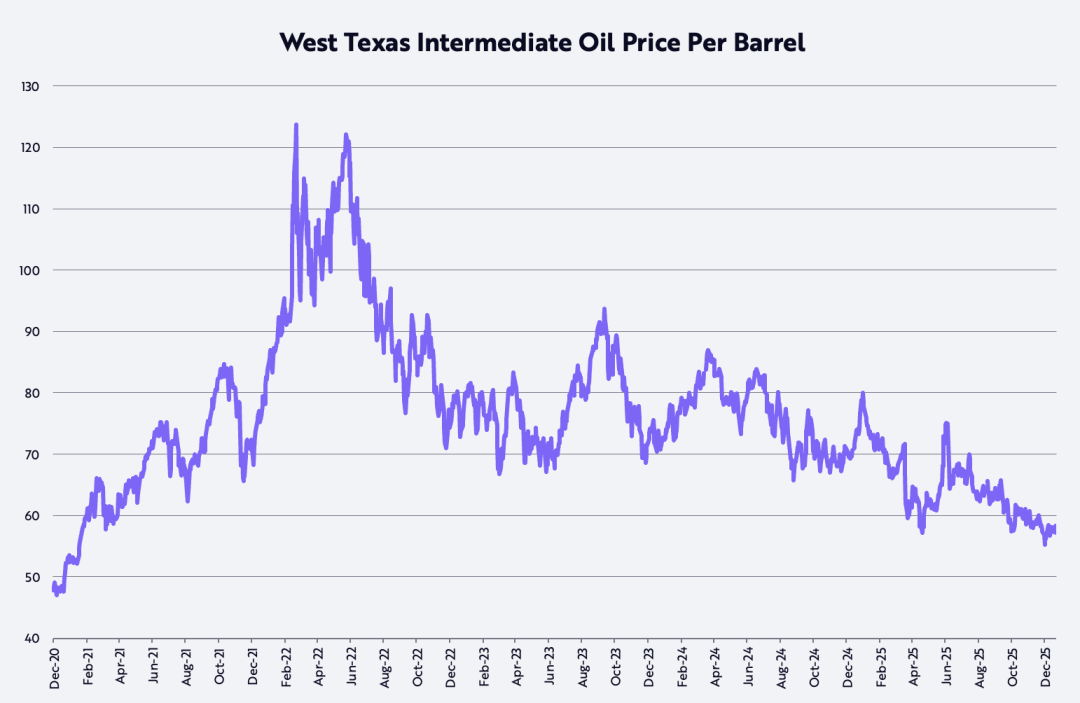
首先,自2022年3月8日疫情后的高点、约124美元/桶以来,西德克萨斯中质原油(WTI)价格已下跌约53%,目前同比下降约22%。
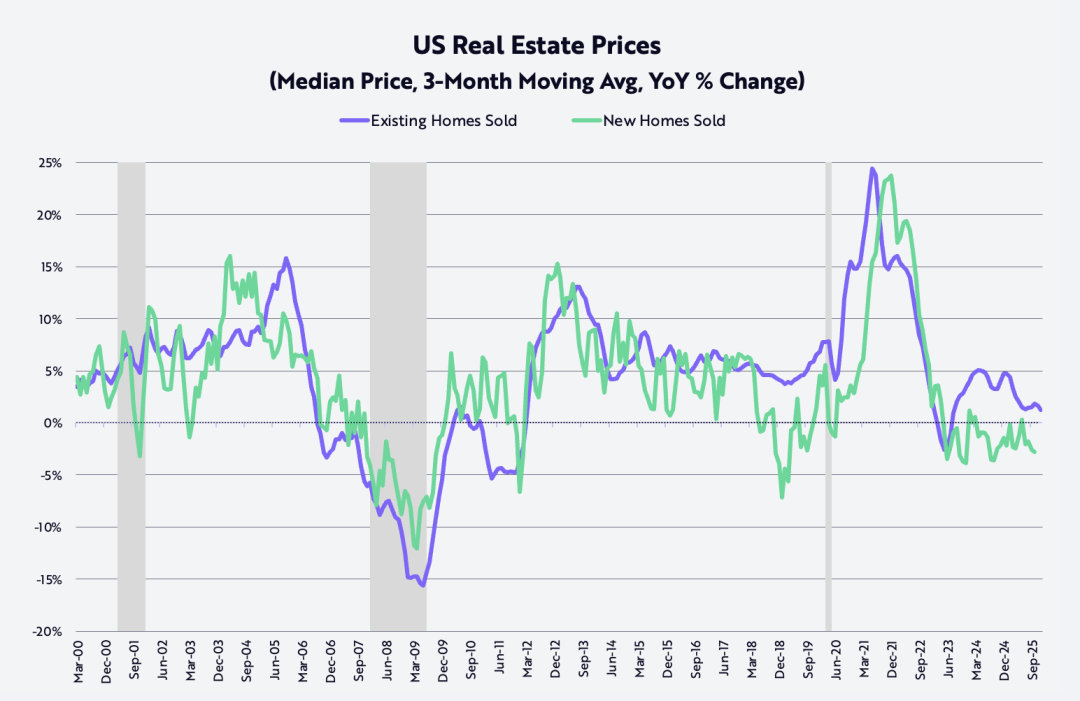
其次,自2022年10月见顶以来,新建独栋住宅的销售价格已下跌约15%;
而成屋独栋住宅价格通胀(以三个月移动平均计算)则从2021年6月疫情后的同比峰值约24%,大幅回落至目前的约1.3%,如下图所示。
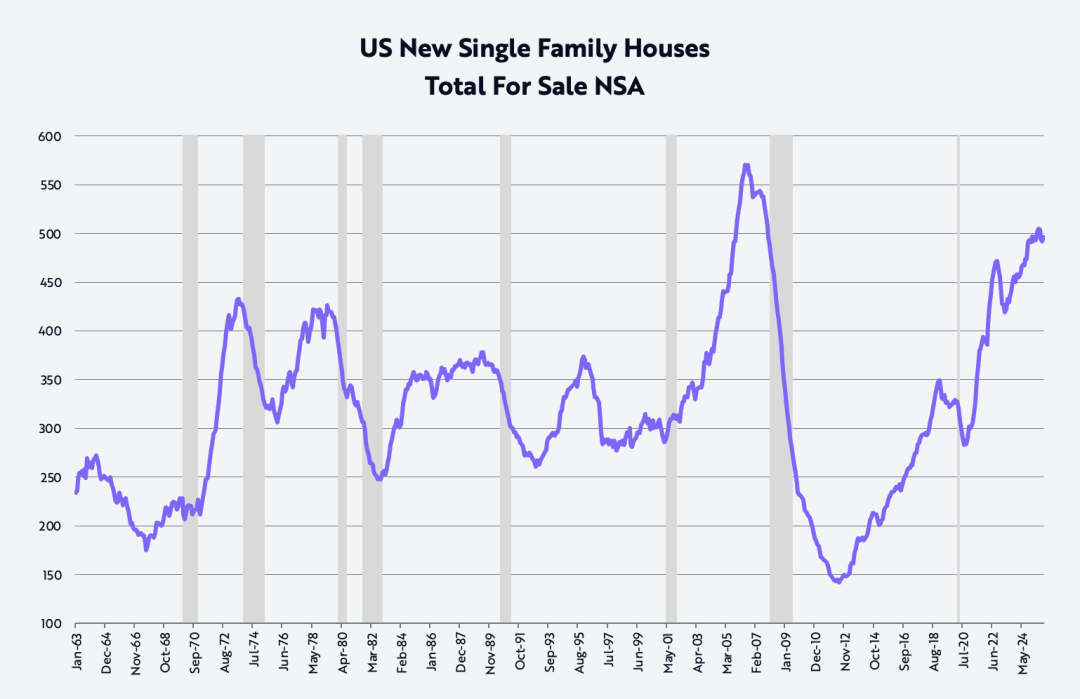
此外,在第四季度,为了去化已接近50万套的新建独栋住宅库存,这一水平上一次出现还是在2007年10月,全球金融危机前夕。
三家主要住宅建商在同比基础上大幅降价:
Lennar同比下降10%,KB Homes下降7%,D.R. Horton下降3%。这些价格下调将在未来几年中以滞后的方式逐步传导并体现在CPI中。
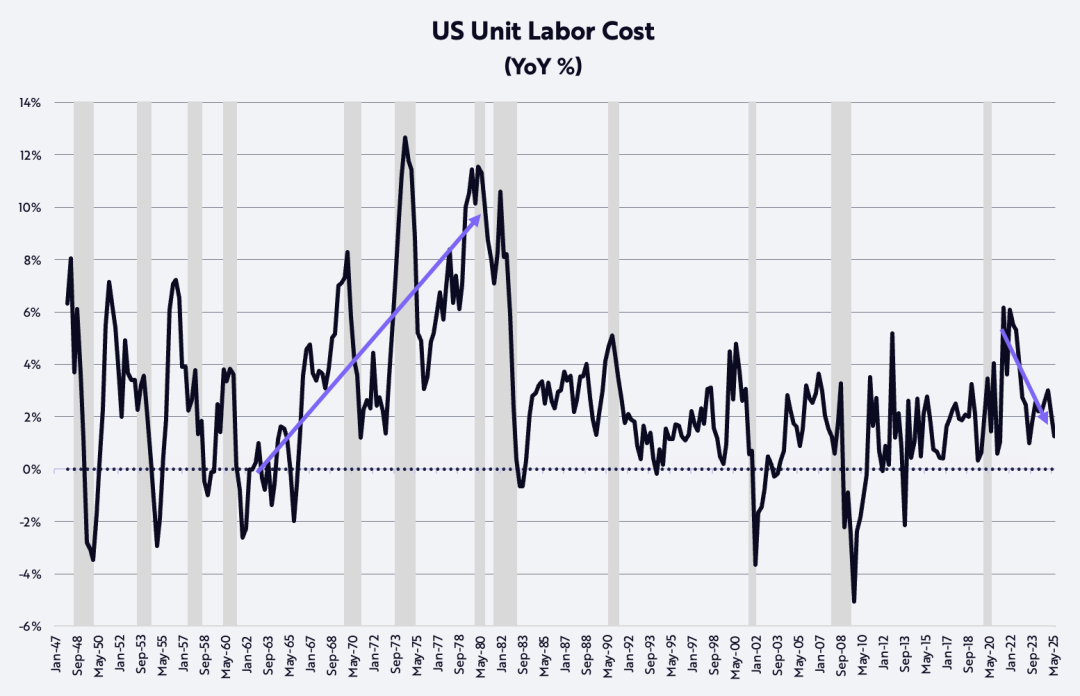
最后,非农生产率,这一对抗通胀最强有力的因素之一,在滚动式衰退背景下依然表现强劲,第三季度同比增长1.9%。
与每工时薪酬增长3.2%相对照,生产率提升已将单位劳动力成本通胀压低至1.2%,如下图所示。这个数字中,完全看不到上世纪70年代那种“成本推动型通胀”的影子。
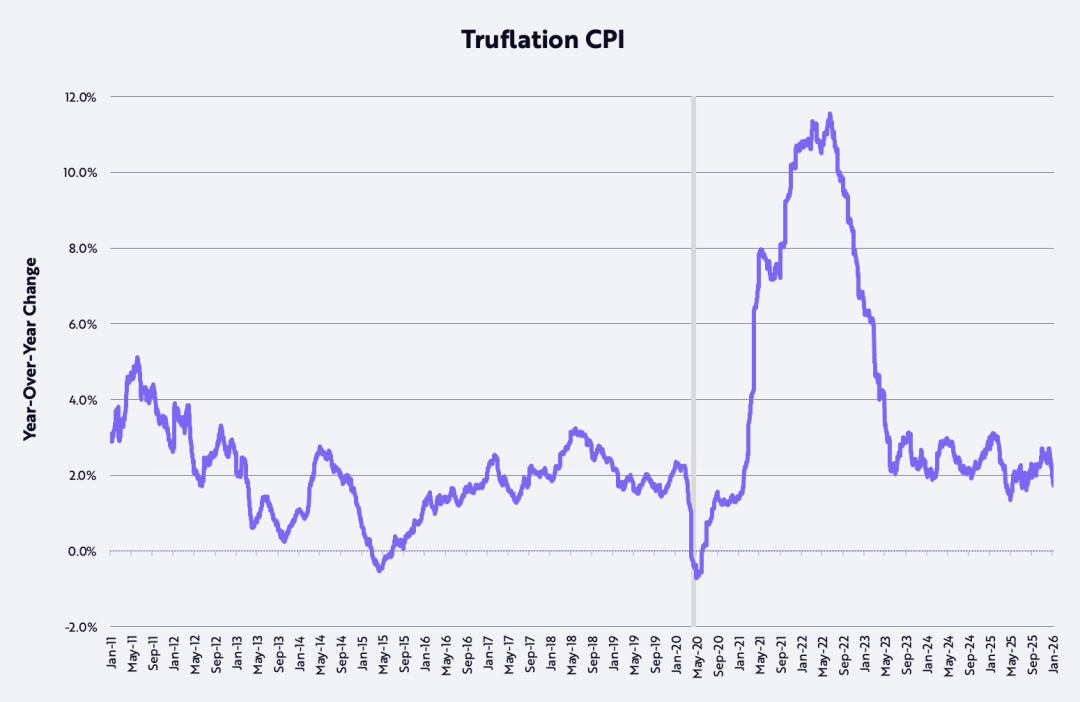
进一步印证这一改善趋势的是,Truflation指标衡量的通胀率近期已降至同比1.7%,如下图所示,比美国劳工统计局(BLS)基于CPI的官方通胀数据低近100个基点(bps)。
生产率繁荣(Productivity Boom)
如果我们关于技术驱动型颠覆式创新的研究判断成立,未来几年非农生产率增速可能加快至4%–6%,从而进一步压低单位劳动力成本通胀。
AI、机器人、储能、公链和多组学技术的融合,不仅会推动生产率进入新平台,还将创造巨大的财富。
生产率的提升,还有可能缓解全球经济中显著的地缘经济失衡。企业可以将生产率红利,沿以下四个战略方向中的一个或多个进行分配:
扩大利润率、增加研发及其他投资、提高员工薪酬,和降低产品价格。
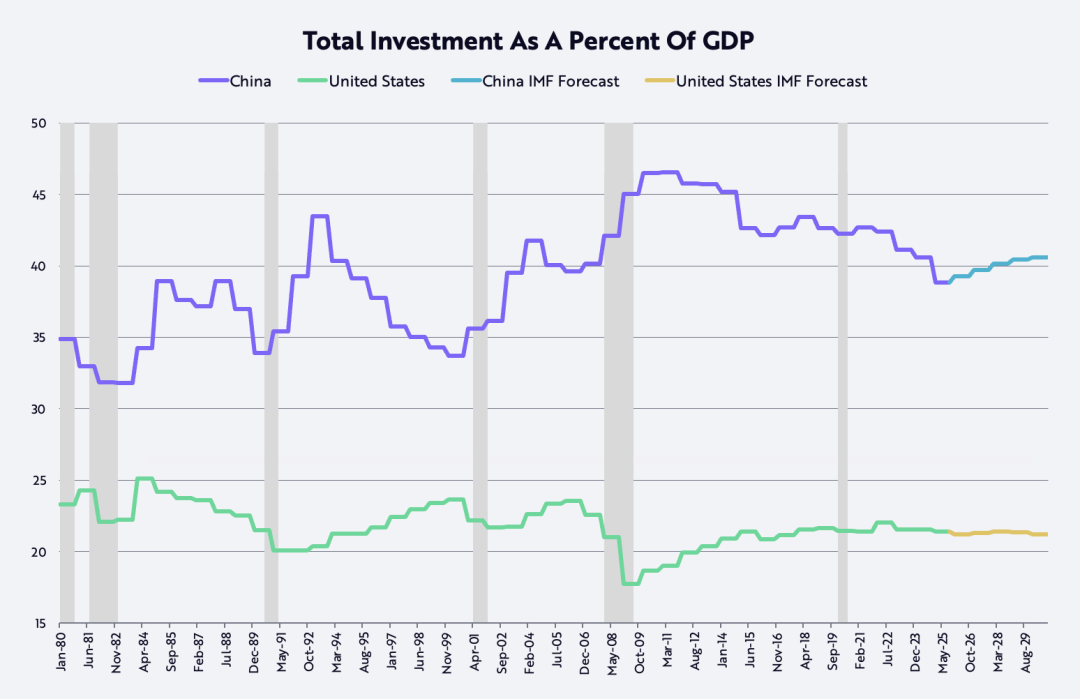
在中国,更高生产率对应的更高薪酬和更高利润率,有助于经济结构从长期以来平均占GDP约40%、几乎是美国两倍的过度投资,转向更加均衡的发展路径(如下图所示)。
自2001年加入世界贸易组织(WTO)以来,这一投资比例一直偏高。
提高劳动者收入,将推动中国经济由投资与“内卷式竞争”转向消费导向,这也符合习近平主席提出的“反内卷”目标。
与此同时,美国企业则可能通过增加投资和/或降低价格,进一步提升其相对于中国企业的竞争力。
不过需要指出的是,在短期内,技术赋能的生产率提升,可能会继续放缓美国的就业增长,使失业率从4.4%上升至5.0%甚至更高,并由此促使美国联邦储备委员会(美联储)继续降息。
在此之后,去监管及其他财政刺激措施,有望放大低利率的作用,在2026年下半年显著加快GDP增长。
与此同时,通胀大概率继续放缓。不仅因为油价、房价和关税下降,也因为推动生产率上升、压低单位劳动力成本的,正是这些同样的技术力量。
令人惊讶的是,根据部分基准测算,AI训练成本正以每年约75%的速度下降,而AI推理成本(即运行AI应用模型的成本)甚至最高可达每年99%的降幅。
这种前所未有的技术成本下降,将推动相关产品和服务在数量层面出现爆发式增长。
因此,我们并不意外未来几年美国名义GDP增速有可能维持在6%–8%区间,其动力来源包括:
5%–7%的生产率增长、约1%的劳动力规模增长,以及-2%至+1%的通胀水平。
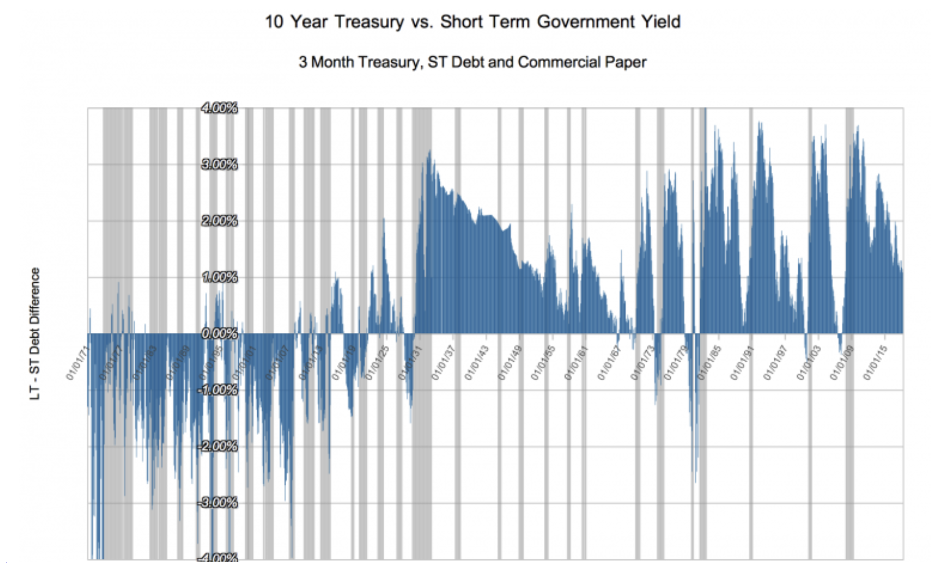
AI以及另外四大创新平台所带来的通缩效应,将不断叠加,营造出一种经济背景,类似于截至1929年的那50年间,由内燃机、电力和电话通信所引发的上一轮重大技术革命时期。
在那段历史中,短期利率基本与名义GDP增速同步,而长期利率则对技术繁荣所伴随的通缩暗流作出反应,结果是收益率曲线平均倒挂约100个基点,如下图所示。
其他新年思考(OTHER NEW YEAR THOUGHTS)
黄金价格上涨vs比特币价格下跌
在2025年,黄金价格上涨了65%,而比特币价格下跌了6%。许多观察者将自2022年10月美国股市熊市结束以来,黄金价格从1,600美元上涨至4,300美元(累计上涨166%),归因于对通胀风险的担忧;
但另一种解读是,全球财富创造的速度,例如MSCI全球股票指数上涨93%,已经超过了全球黄金供应量约1.8%的年化增长率。
换言之,黄金的新增需求,可能正在超过其供给增长。有趣的是,在同一时期内,在比特币供应量年化仅增长约1.3%的情况下,其价格却上涨了360%。
在这一对比中,一个重要的差异在于:黄金矿商与比特币“矿工”对价格信号的反应方式完全不同。
黄金矿商可以通过增加产量来回应价格上涨,而比特币则无法做到这一点。
比特币的供应增长是由数学规则严格限定的:未来两年其年增长率约为0.82%,随后将进一步放缓至约0.41%。
从历史视角看黄金价格(The Gold Price In Perspective)
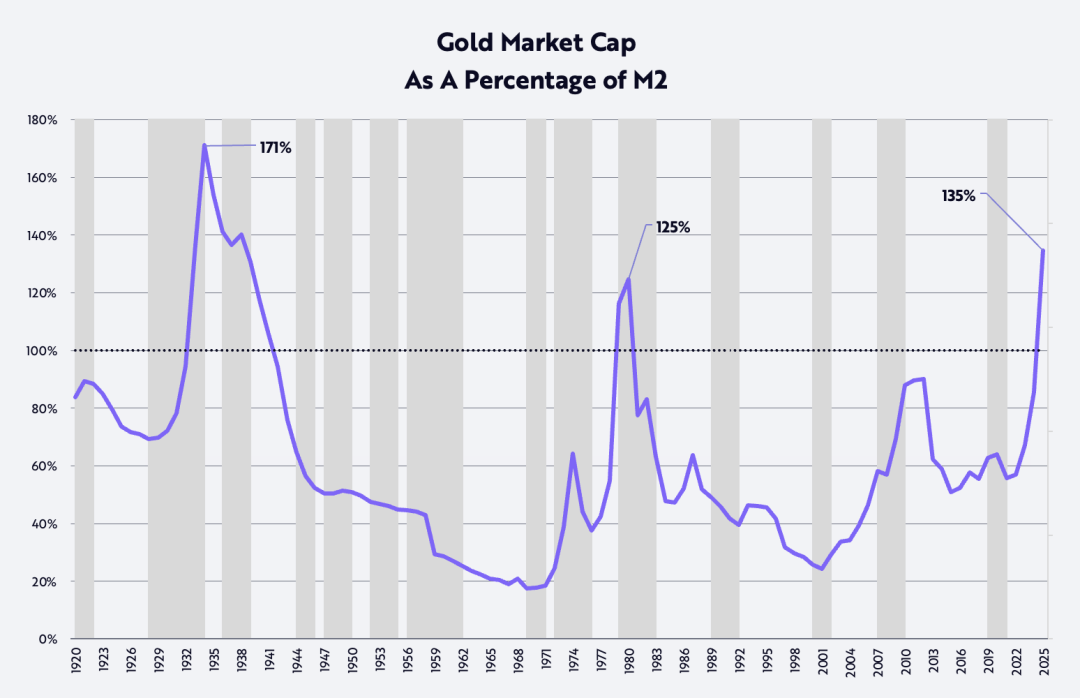
以黄金市值与M2货币供应量之比来衡量,在过去125年中,这一比值只在一个时期高于当前水平,即20世纪30年代初的大萧条时期,当时黄金价格被固定在每盎司20.67美元,而M2货币供应量却暴跌约30%,如下图所示。
近期,黄金—M2比值已突破此前的历史高点,而那个高点出现在1980年,当时通胀和利率均飙升至两位数水平。也就是说,从历史维度看,当前黄金价格已处于极端水平。
同样值得注意的是,从下图可以看到,这一比值在长期内的下行阶段,往往对应着股票市场的良好回报。
自1926年以来,根据Ibbotson和Sinquefield的研究,股票的长期复合年化回报率约为10%。
在该比值于1934年和1980年分别触及两个长期高点之后,以道琼斯工业平均指数(DJIA)衡量,股票价格在截至1969年的35年和截至2001年的21年中,分别上涨了670%和1,015%,对应的年化回报率分别为6%和12%。
值得注意的是,小盘股在这两个阶段的年化回报率分别高达12%和13%。
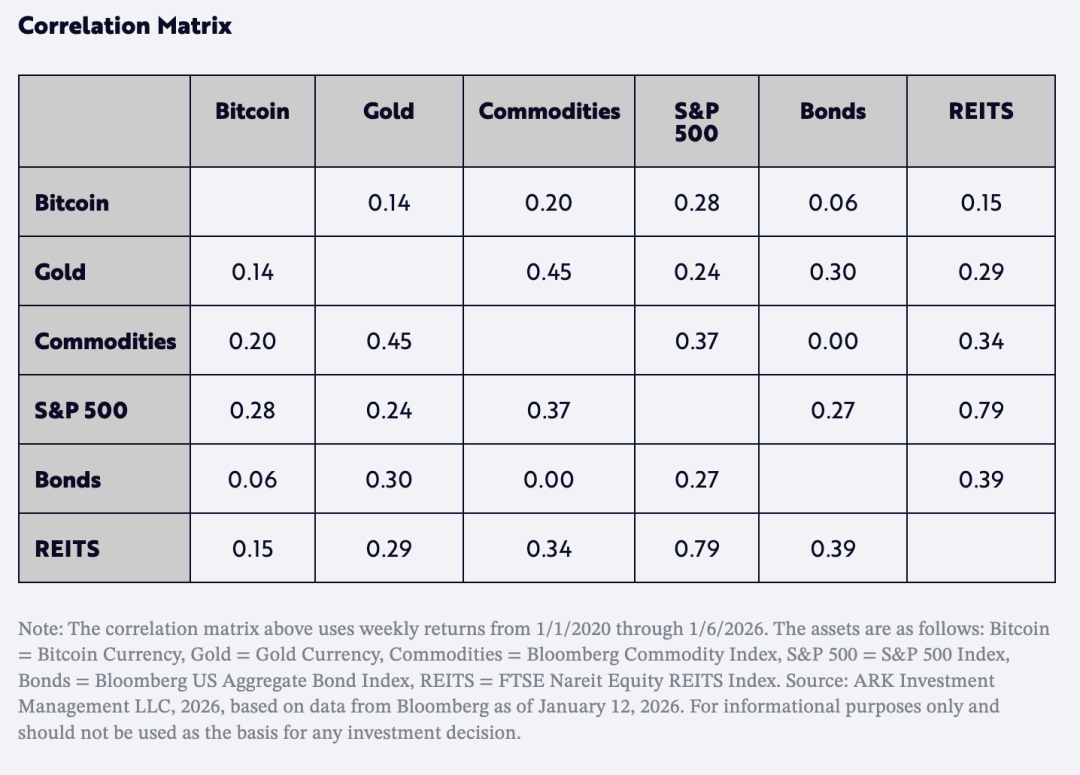
另一个对资产配置者而言非常重要的因素是:自2020年以来,比特币回报率与黄金、以及其他主要资产类别的相关性都非常低,如下表所示。
更有意思的是,比特币与黄金之间的相关性,甚至低于标普500指数与债券之间的相关性。
换言之,在未来几年中,比特币有望成为资产配置者提升“单位风险回报”的重要分散化工具。
美元前景(The Dollar’s Outlook)
过去几年,一个广为流传的叙事是:“美国例外主义”正在终结。这一观点的代表性证据包括:
美元在某一上半年中的跌幅,创下1973年以来最大纪录;按全年计算,则是2017年以来最显著的年度下跌。
去年,以贸易加权美元指数(DXY)衡量,美元在上半年下跌11%,全年下跌9%。
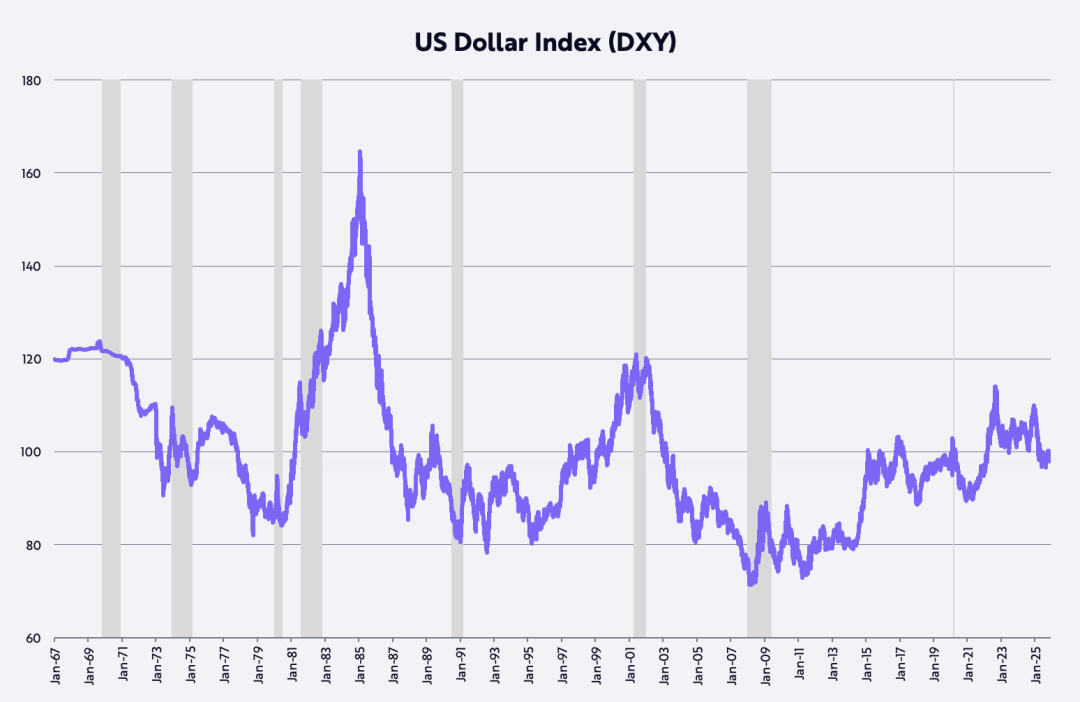
如果我们对财政政策、货币政策、去监管以及由美国主导的技术突破的判断是正确的,那么,美国的投资资本回报率将相对全球其他地区上升,从而推动美元走强。
特朗普政府的政策,正在呼应20世纪80年代里根经济学初期的情形——当时美元几乎翻了一倍,如下图所示。
AI热潮(AI Hype)
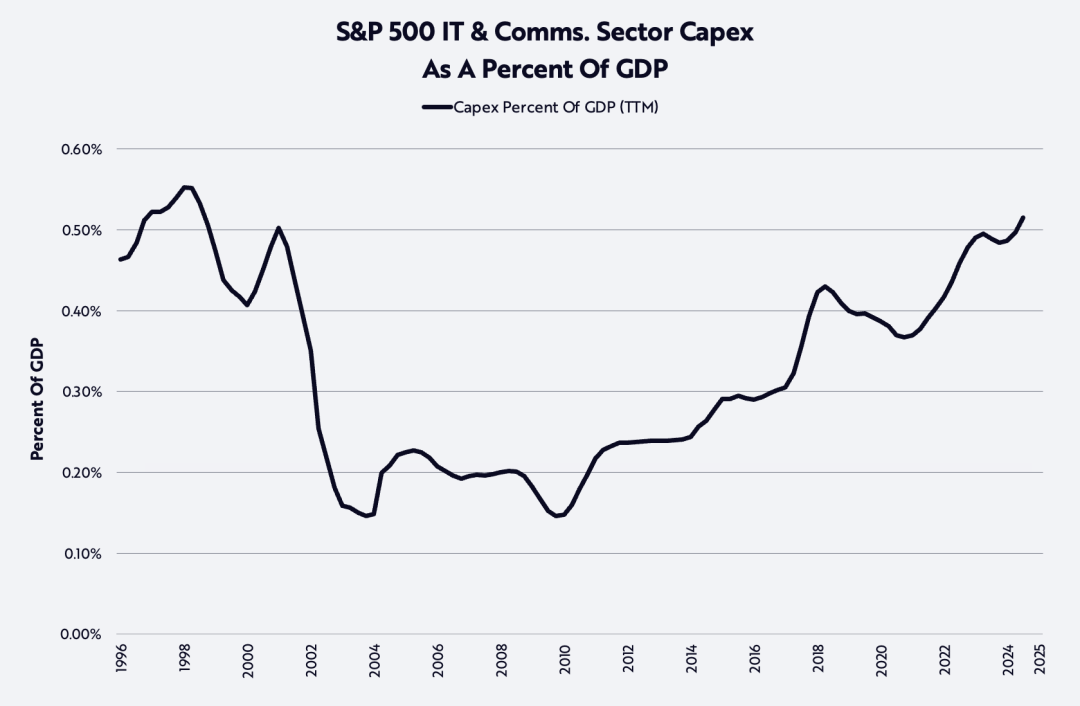
AI浪潮正推动资本支出升至自90年代末以来未见的高位,如下图所示。
2025年,用于数据中心系统(计算、网络和存储设备)的投资增长47%,接近5,000亿美元;
预计2026年将再增长20%,达到约6,000亿美元,远高于ChatGPT问世前十年中每年1,500亿–2,000亿美元的长期趋势水平。
如此巨大的投资规模,自然引出了一个关键问题:这些投资的回报将来自哪里,又将由谁获得?
除了半导体和公开市场中的大型云计算公司之外,尚未上市的AI原生企业,正成为这轮增长与投资回报的重要受益者。AI公司正成为历史上增长最快的一批企业。
根据我们的研究,消费者采纳AI的速度,是90年代采用互联网时的两倍,如下图所示。
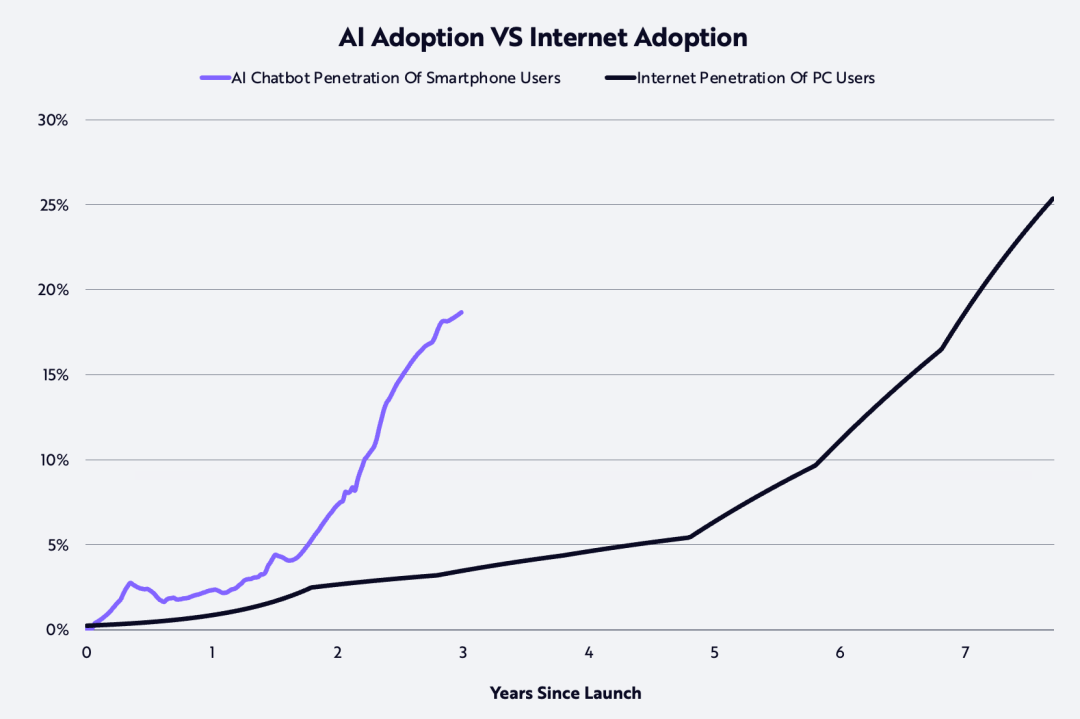
截至2025年年底,据报道OpenAI和Anthropic的年化收入运行率分别达到200亿美元和90亿美元,仅用一年时间,就分别从16亿美元和1亿美元增长了12.5倍和90倍。
市场传闻称,这两家公司都在考虑在未来一到两年内进行IPO,以为支撑其产品模型所需的巨额投资提供资金。
正如OpenAI应用业务CEOFidji Simo所言:
“AI模型的能力,远远超过了大多数人日常所体验到的水平,而2026年的关键在于缩小这一差距。AI领域的领导者,将是那些能够把前沿研究,转化为对个人、企业和开发者都真正有用的产品的公司。”
今年,用户体验层面有望在这一方向上取得实质性进展,变得更加有意图、更直观、也更高度整合。
一个早期例子是ChatGPT Health——这是ChatGPT内部的一个专区,旨在基于用户的个人健康数据,帮助其进行健康与医疗管理。
在企业端,许多AI项目仍处于早期阶段,受制于官僚流程、惯性,以及在AI真正发挥价值之前,必须先进行组织重构和数据基础建设的现实条件。
到2026年,企业很可能会意识到:必须基于自身数据训练模型并快速迭代,否则就会被更激进的竞争者甩在身后。
由AI驱动的应用场景,将带来即时且卓越的客户服务、更快的产品发布节奏,以及“以更少资源完成更多事情”的创业公司。
市场高估值(High Valuation Of The Market)
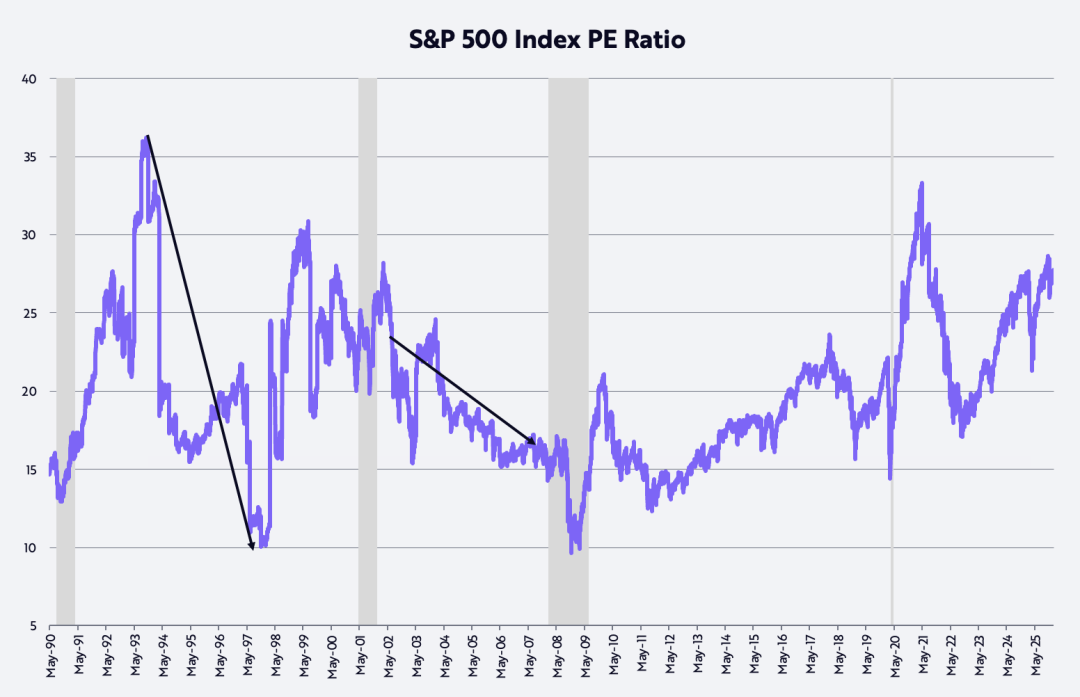
许多投资者对股票市场估值表示担忧,目前的水平处于其历史区间的高端,如下图所示。
我们自身的估值假设是:市盈率(P/E)倍数将回落至过去35年的平均水平——约20倍。
一些最显著的牛市,正是在倍数收缩的过程中演化而来的。例如:
1993 年 10 月中旬至1997 年 11 月中旬,标普 500 指数年化回报率 21%,同期 P/E 从 36 倍降至 10 倍。
2002 年 7 月至 2007 年 10 月,标普 500 指数年化回报率 14%,同期 P/E 从 21 倍收缩至 17 倍。
鉴于我们对生产率驱动下的实际GDP增长加速以及通胀放缓的预测,在本轮市场周期中,这一动态很可能再次出现——甚至可能表现得更为显著。
衷心感谢一如既往支持ARK的投资者和其他朋友,也感谢Dan、Will、Katie和Keith帮助我完成这篇篇幅巨大的新年致辞!
免责声明:本文章仅代表作者个人观点,不代表本平台的立场和观点。本文章仅供信息分享,不构成对任何人的任何投资建议。用户与作者之间的任何争议,与本平台无关。如网页中刊载的文章或图片涉及侵权,请提供相关的权利证明和身份证明发送邮件到support@aicoin.com,本平台相关工作人员将会进行核查。


