Analyst Chen Shu: On December 23, Bitcoin and Ethereum surged and then retreated, waiting for a breakout from the sideways consolidation area.
From the daily chart, Bitcoin formed a green doji candlestick yesterday, with the price attempting to break above the 30-day moving average but failing. In the short term, attention remains on the breakout level of 8.95; if it breaks, we will look for more bullish signals. On the hourly chart, the price rebounded yesterday and tested the 256-day moving average but failed to hold above it. Currently, it has once again fallen below the 8.8 level, and in the short term, it is expected to consolidate around 8.8 as the center of oscillation. We should focus on the breakout direction of this oscillation area.
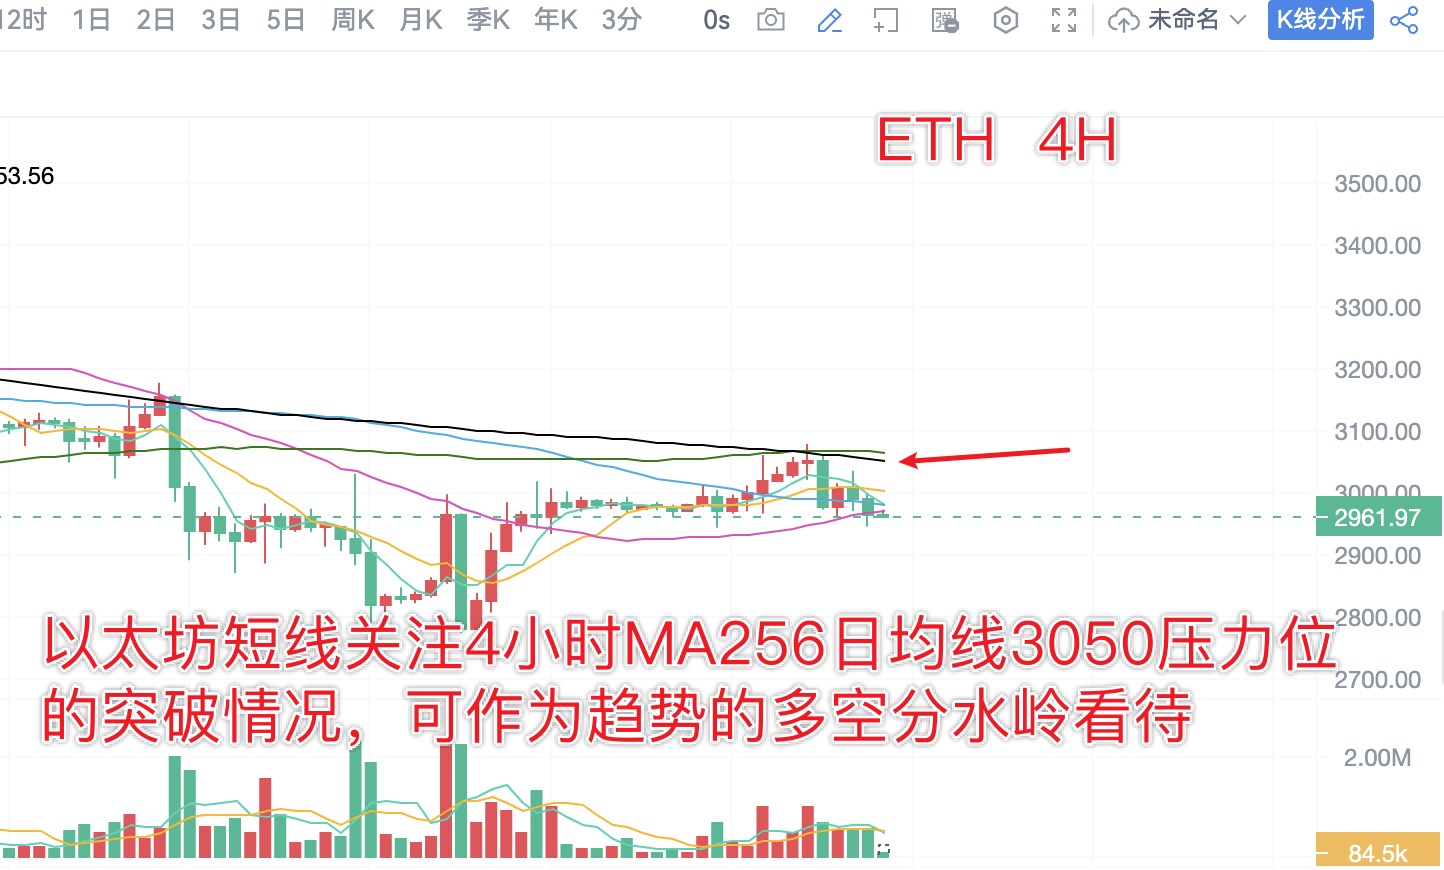
From the daily chart, Ethereum also rebounded and tested the 30-day moving average at the 3030 resistance level yesterday but failed. The key short-term support and resistance levels still reference the breakout and stabilization at 3030. On the 4-hour chart, the short-term rebound reached the 256-day moving average at 3050 before starting to retreat, with support levels to watch at 2950/2900.
Midday trading strategy (written at 17:20):
BTC: Buy at 8.68, add to long at 8.6 on a pullback, target 8.8/8.9; sell at 8.8/8.95 looking for a pullback of 1-2000 points.
ETH: Buy at 2920, add to long at 2860 on a pullback, target 2980/3020; sell at 2990/3050 looking for a pullback of 6-100 points.
The daily analysis strategy has a very high win rate! Analysis is not easy, so I hope everyone can give a free follow, favorite, like, and comment. Thank you all, and feel free to leave comments below; I will reply to each one.

免责声明:本文章仅代表作者个人观点,不代表本平台的立场和观点。本文章仅供信息分享,不构成对任何人的任何投资建议。用户与作者之间的任何争议,与本平台无关。如网页中刊载的文章或图片涉及侵权,请提供相关的权利证明和身份证明发送邮件到support@aicoin.com,本平台相关工作人员将会进行核查。


