链上数据摘要
链上活动与资金流概况总览
为了准确评估区块链生态的真实使用情况,本节将从多项关键链上活动指标切入,包括每日交易量、Gas 费用、活跃地址数与跨链桥接的净流量,涵盖了用户行为、网络使用强度与资产流动性等多个维度。相较于仅观察资金流入流出,这些链上原生数据能更全面反映公链生态的基本面变化,帮助判断资本流向背后是否伴随实际使用需求与用户增长,从而识别出具有持续性发展的网络基础。
交易量分析:Solana 仍居高位,主流公链维持稳健活动度
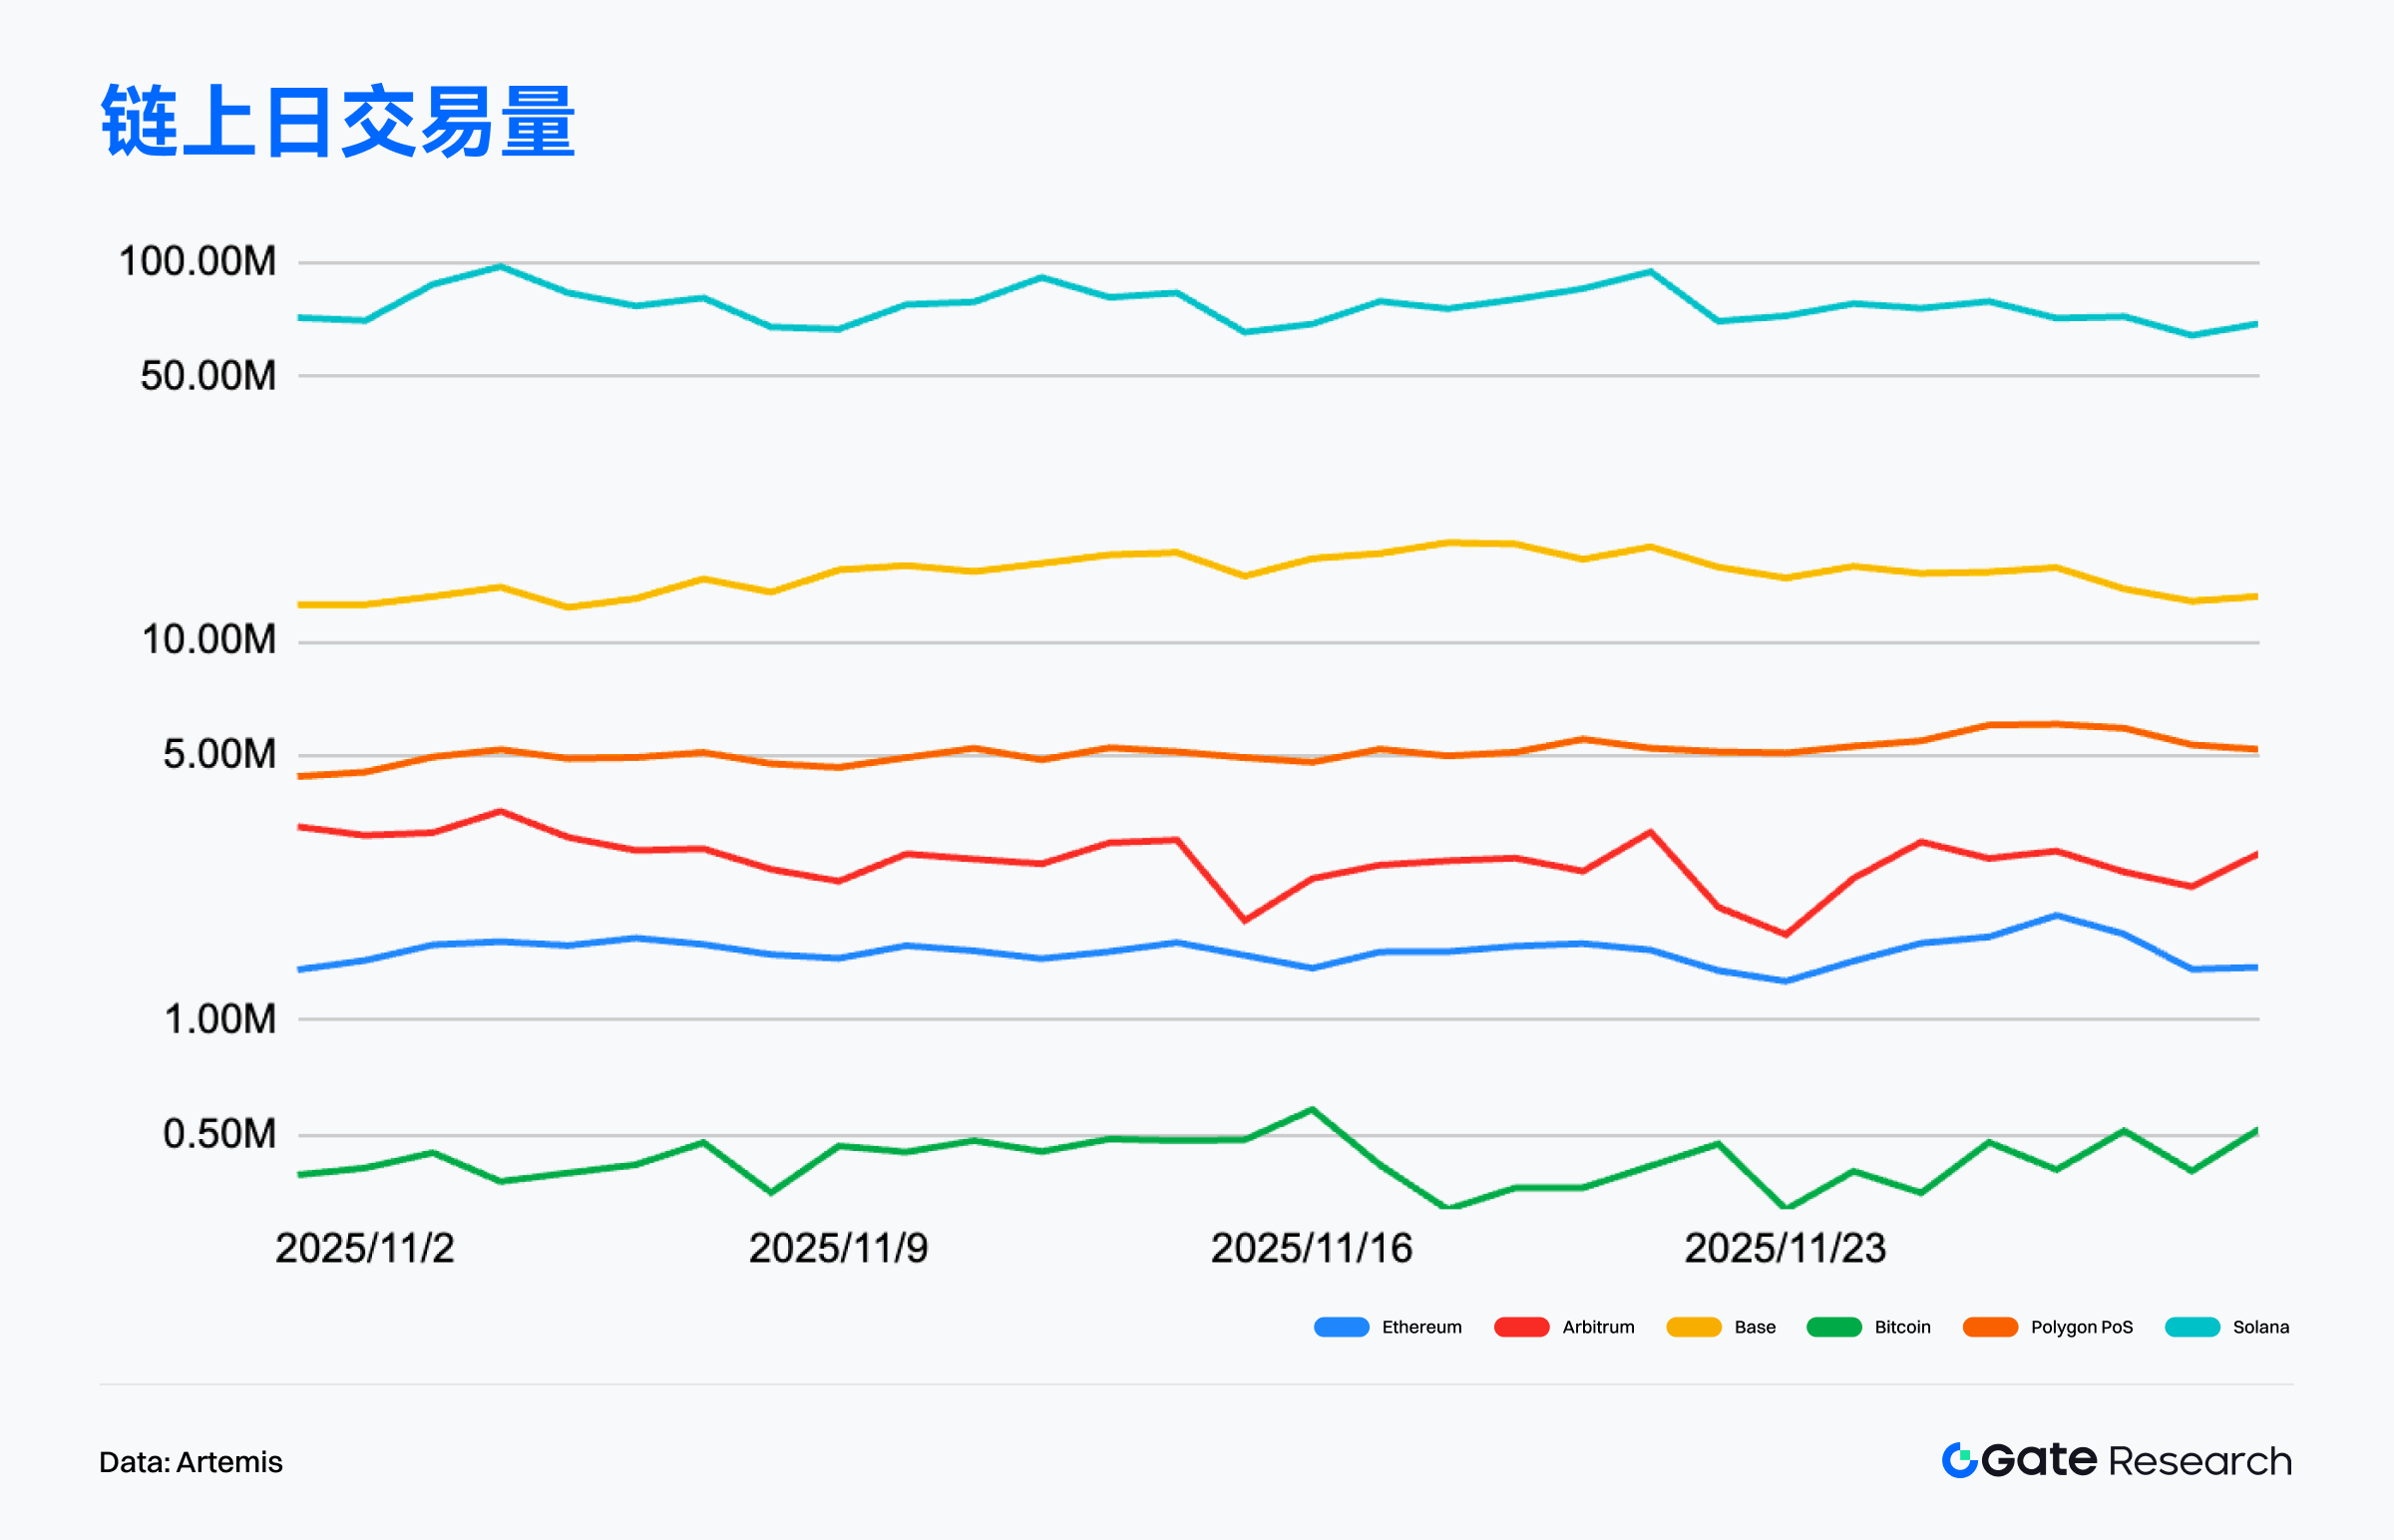
据 Artemis 数据,11 月多条主流公链的链上交易活动整体维持温和上行,呈现高性能公链主导、Layer2 逐步回暖的结构性格局。从趋势来看,Solana 全月维持显著领先,日交易量多落在 7,000 万至 1 亿笔区间,并在月中与月末多次冲高,显示其高频交互应用持续支撑生态活跃度,即使在市场震荡期间,使用强度仍保持稳定。【1】
Base 的整体走势呈温和向上趋势,交易量由 9 月的约 1,000 万笔逐步走高至 11 月的 1,200–1,400 万笔区间,月度结构相对稳定,反映其社交与轻量化应用生态持续带来稳健交互需求。相比之下,Arbitrum 的链上交易量在三个月内呈现典型横盘震荡结构:整体落在 250–450 万笔区间反复波动,但没有持续性的趋势性抬升。从中期结构来看,Arbitrum 并未出现市场常见叙事所描述的“持续回暖”或“交易显著复苏”,更贴近维持弱势区间震荡、生态活动处于平稳但未扩张的状态。
总体而言,近三个月的交易量结构呈现以下特征,Solana 高位稳固,无视市场波动的强趋势链。Base 中期趋势轻微上行,生态扩散效应持续。这或意味着链上活动的分层依旧清晰,高性能链推动整体流量,Layer2 中仅 Base 有结构性改善,而 Arbitrum 当前更贴近“稳定但不扩张”的状态,市场应避免过度解读其短期波动为趋势性回暖。
活跃地址分析:Solana 强势领跑,Arbitrum 维持低位震荡
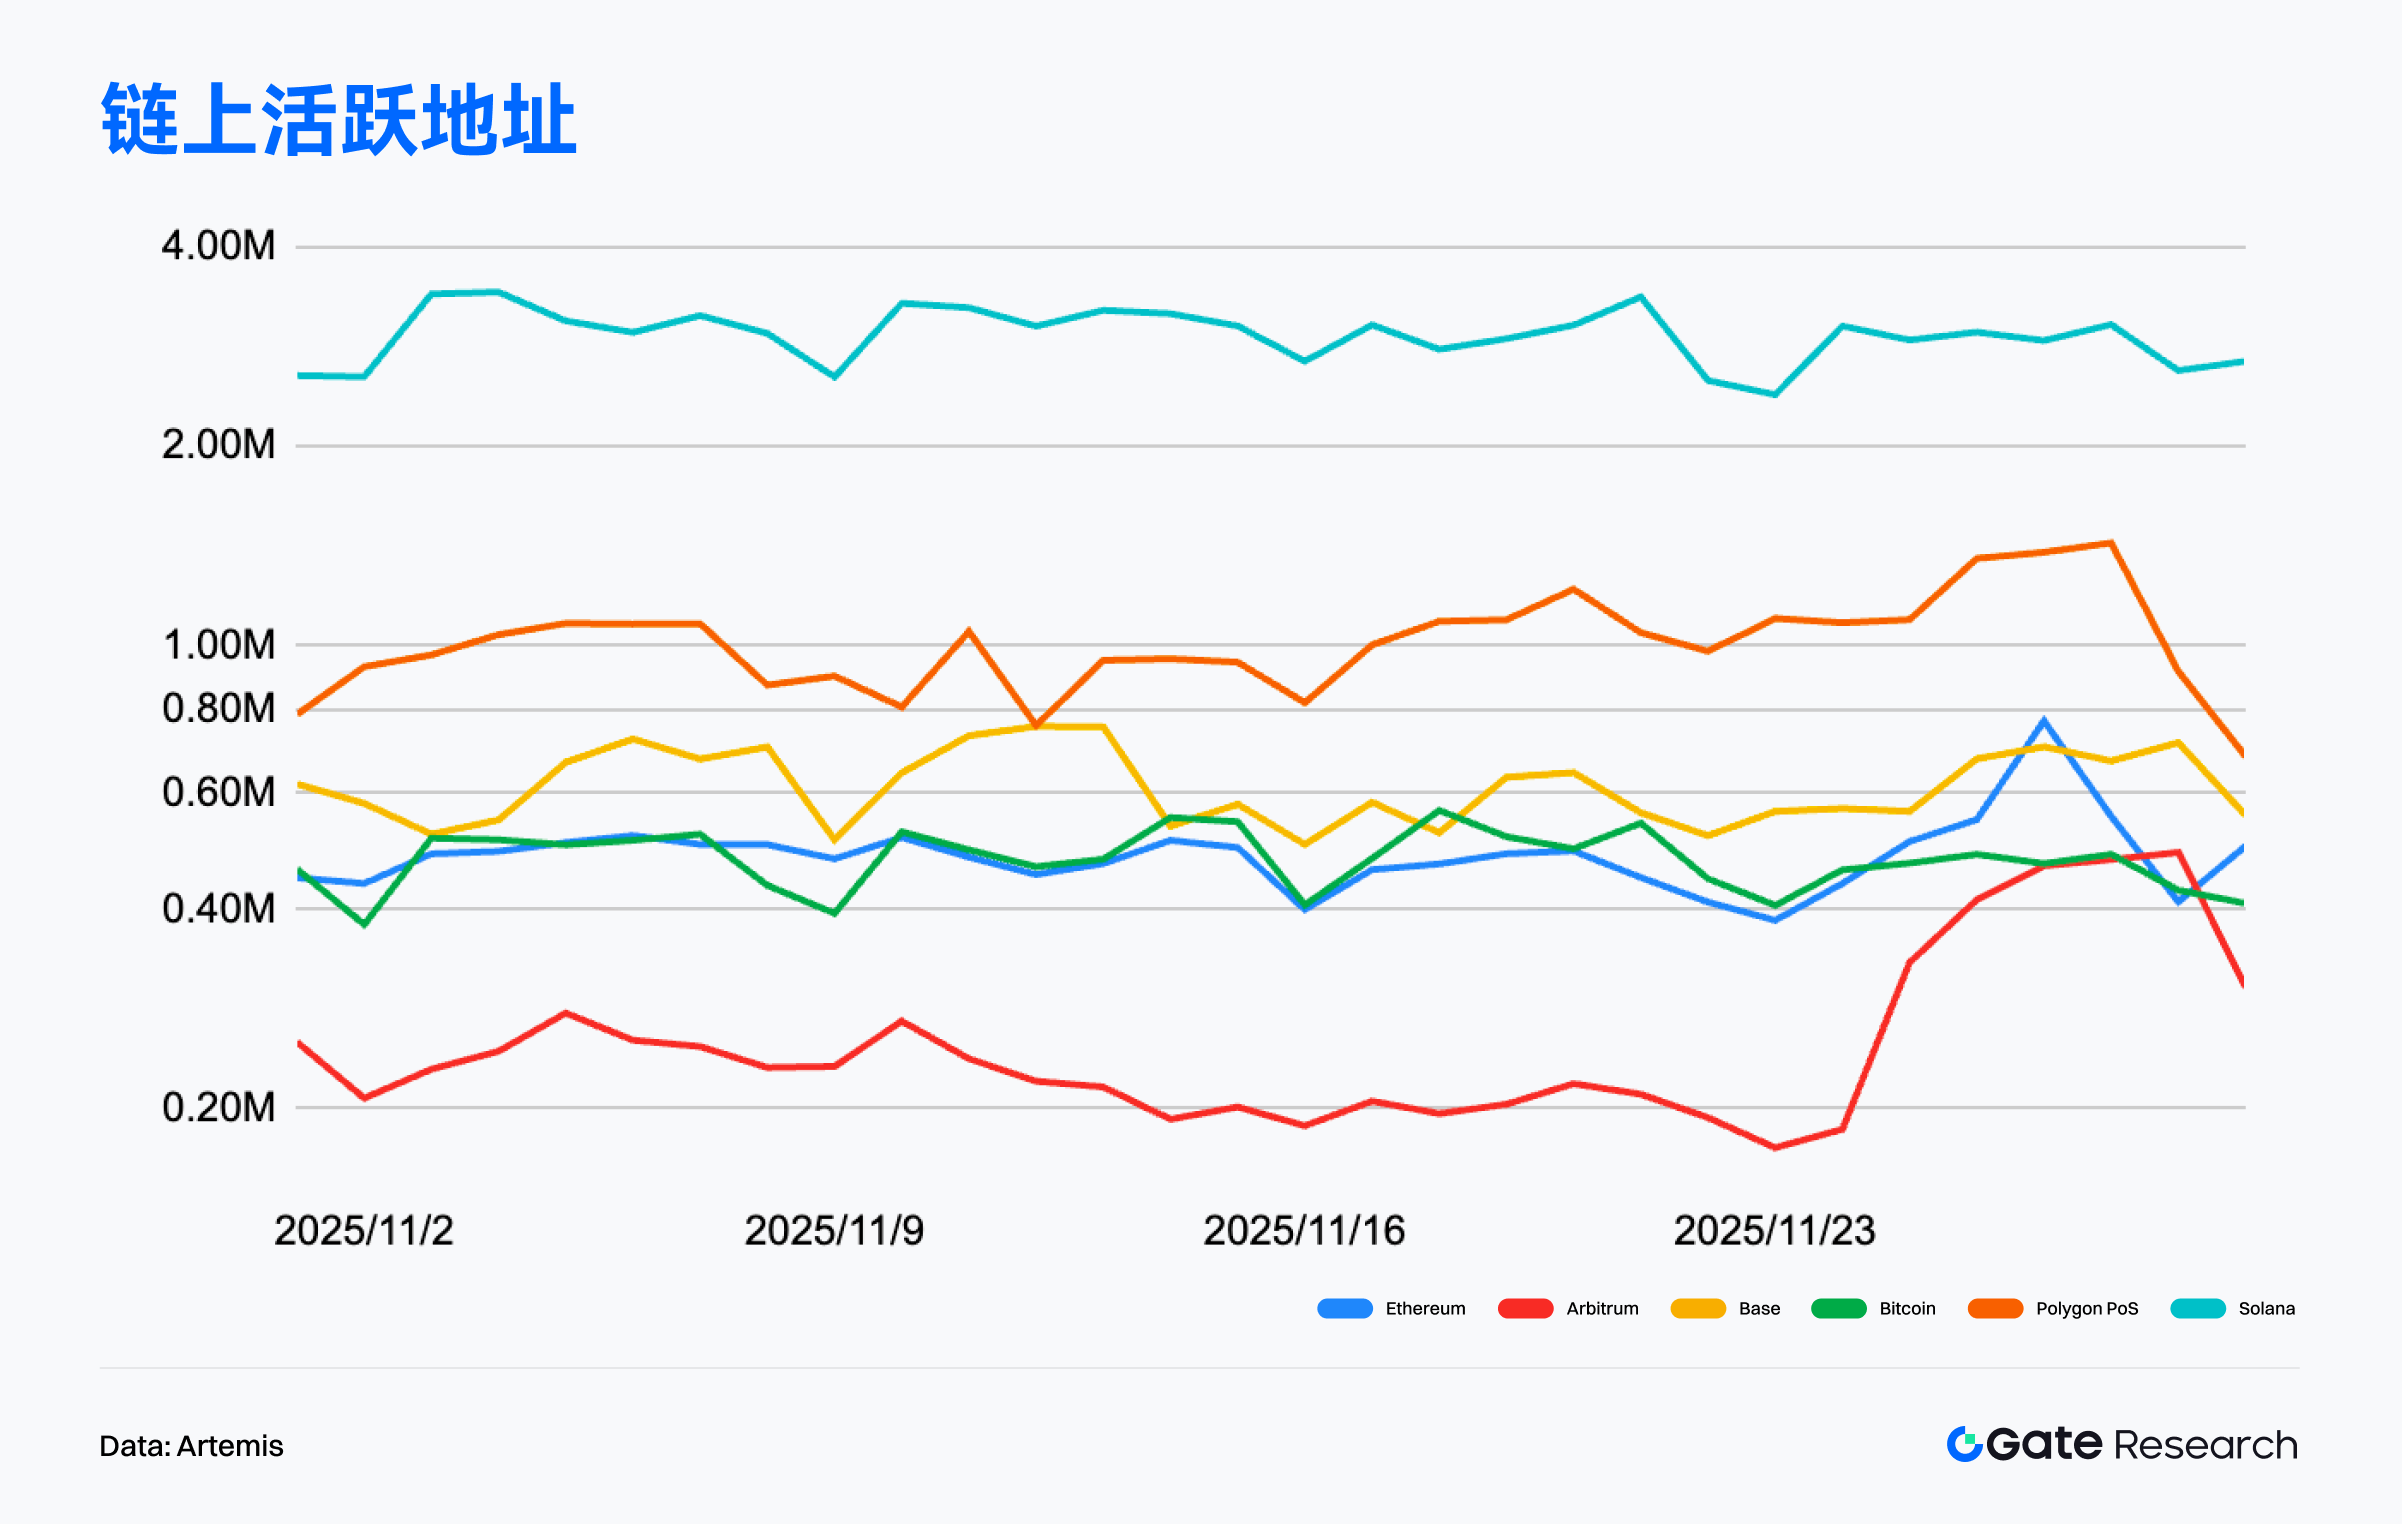
据 Artemis 数据,11 月多链活跃地址整体维持平稳格局,但不同公链间的结构性差异更为明显。Solana 以日均 250 万至 350 万的活跃地址显著领先其他链,虽有周期性震荡,但整体维持高位运行,显示出其应用生态的黏性与高频交互特征。【2】
Polygon PoS 在 11 月表现稳健,活跃地址多落在 80 万至 120 万区间,月末一度突破 130 万,是除 Solana 之外最具活跃度的主链之一。Base 活跃度位居其后,日活约 55 万至 75 万,结构平稳,反映其社交与轻量应用生态仍具持续吸引力。Arbitrum 则呈现更为明显的低位波动,活跃地址自月初约 25–30 万逐步回落至月中低点 18–20 万,虽在月末出现一波反弹,但整体仍处低位震荡区间。相较其他链,Arbitrum 在 11 月的用户交互热度偏弱,显示部分活动可能暂时流向 Base、Polygon 等生态。
整体而言,11 月链上活跃度呈现出分层明显的结构性格局,Solana 稳居高频交互场景的绝对领先地位,活跃度远超其他公链;Polygon PoS 则稳定高于 Base,显示其生态仍具稳健且持续扩张的用户基础。主链层的 Ethereum 与 Bitcoin 则维持稳定运行,活跃度未出现显著扩张或收缩,继续扮演价值结算与系统稳定性的核心角色。相较之下,Arbitrum 在本月的活跃度明显回落,整体处于周期性低位震荡,显示部分 Layer2 生态热度阶段性降温。整体而言,高性能链继续主导高频交互,中端链稳步扩展,而部分 Layer2 则进入修正阶段,多链生态的分层趋势更加清晰。
链上手续费收入分析:Ethereum 与 Solana 稳居前二,Base 波动加剧
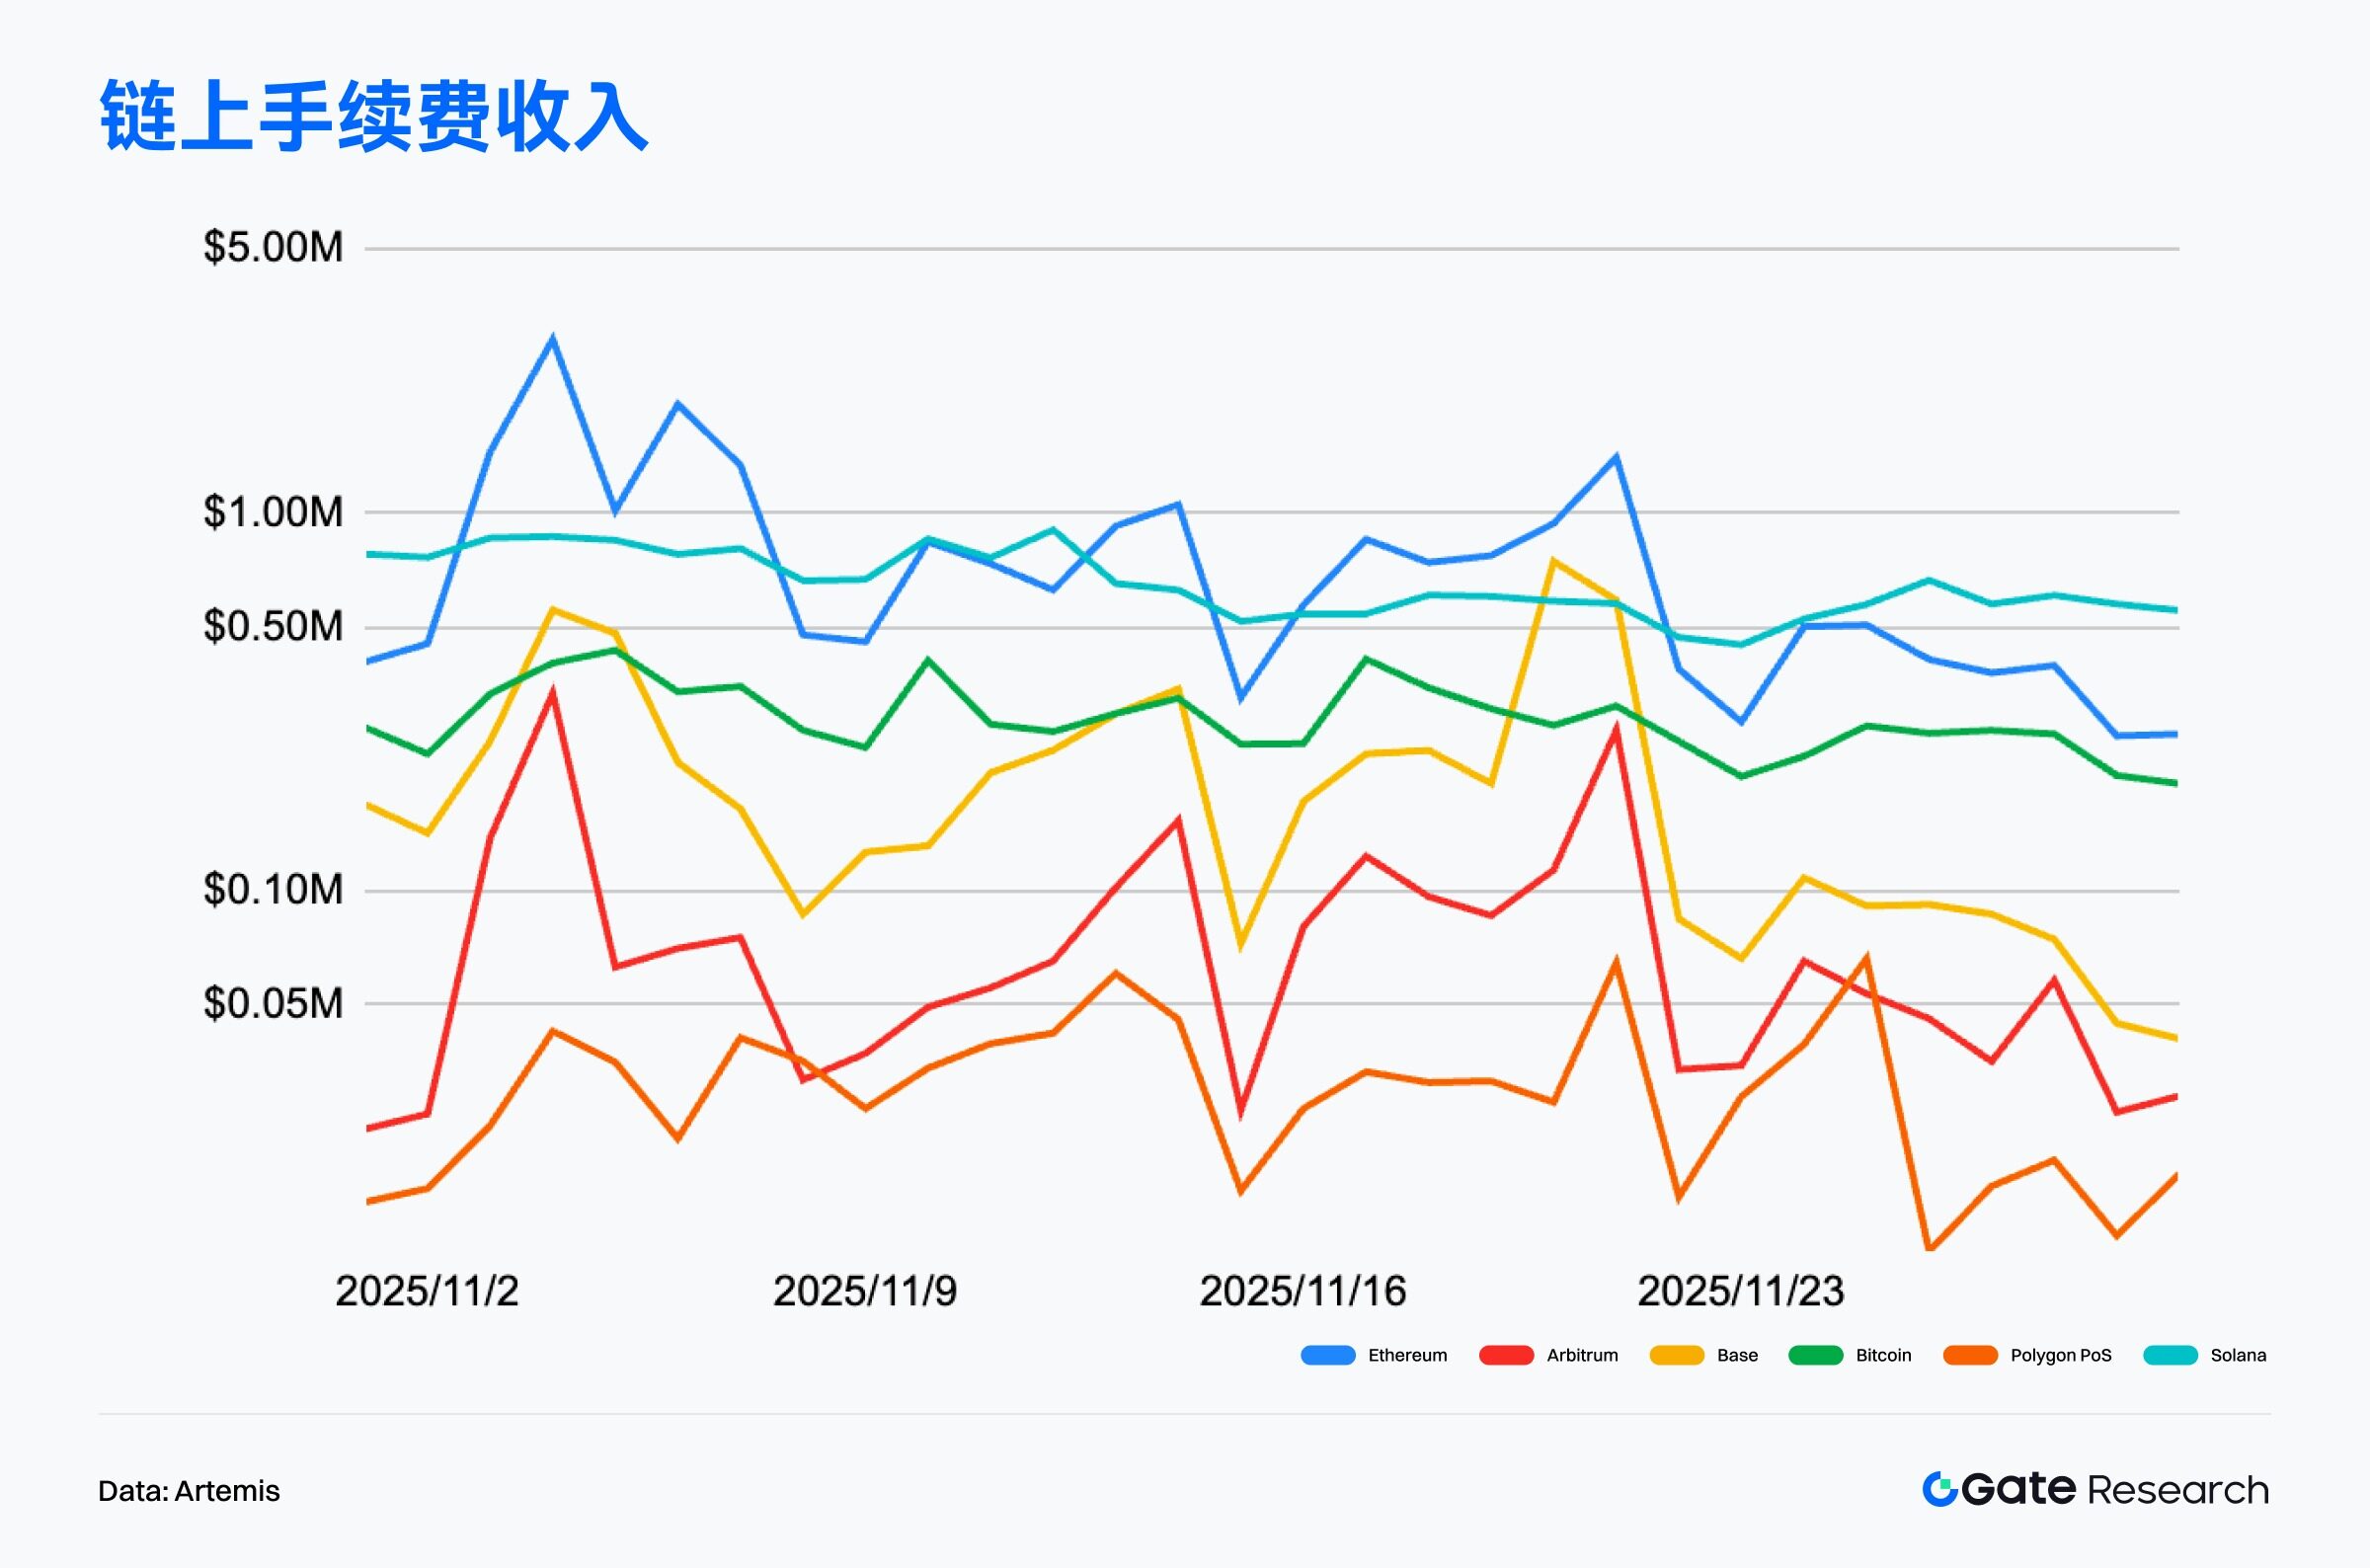
据 Artemis 数据,11 月主流公链手续费收入整体呈现“高价值链稳定领先、中端链波动走弱”的结构性格局。Ethereum 全月收入显著高于其他链,日手续费多落在 50 万至 150 万美元区间,并在月初、月中与月末三次出现明显高点,是最能反映市场活跃度变化的核心链。其手续费结构仍以 DeFi 清算、高价值转账与合约调用为主,巩固其作为主网经济中心的地位。【3】
Solana 继续稳居第二梯队,手续费收入多集中在 80 万至 100 万美元区间,整体波动幅度相对有限,即便市场情绪变化,其高频交易、DEX 活动与应用交互仍维持稳定的收入贡献。与前两者相比,Base 在 11 月呈现更显著的波动特征,日手续费收入从低位的 10 万美元以下多次升至 40–60 万美元的短期高点,月末更出现超 70 万美元的峰值,显示其生态内个别协议或交易活动会阶段性放大链上费用。
整体而言,11 月手续费收入结构呈现清晰分层,Ethereum 与 Solana 稳定领跑、Base 波动中有阶段性放量而 Polygon 与 Arbitrum 维持低位徘徊。整体手续费收入并未出现持续扩张,显示链上经济在低波动行情下更依赖特定事件驱动,而非结构性增长。
公链资金流向分化:Arbitrum 持续领涨,Starknet 与 BTCFi 叙事崛起
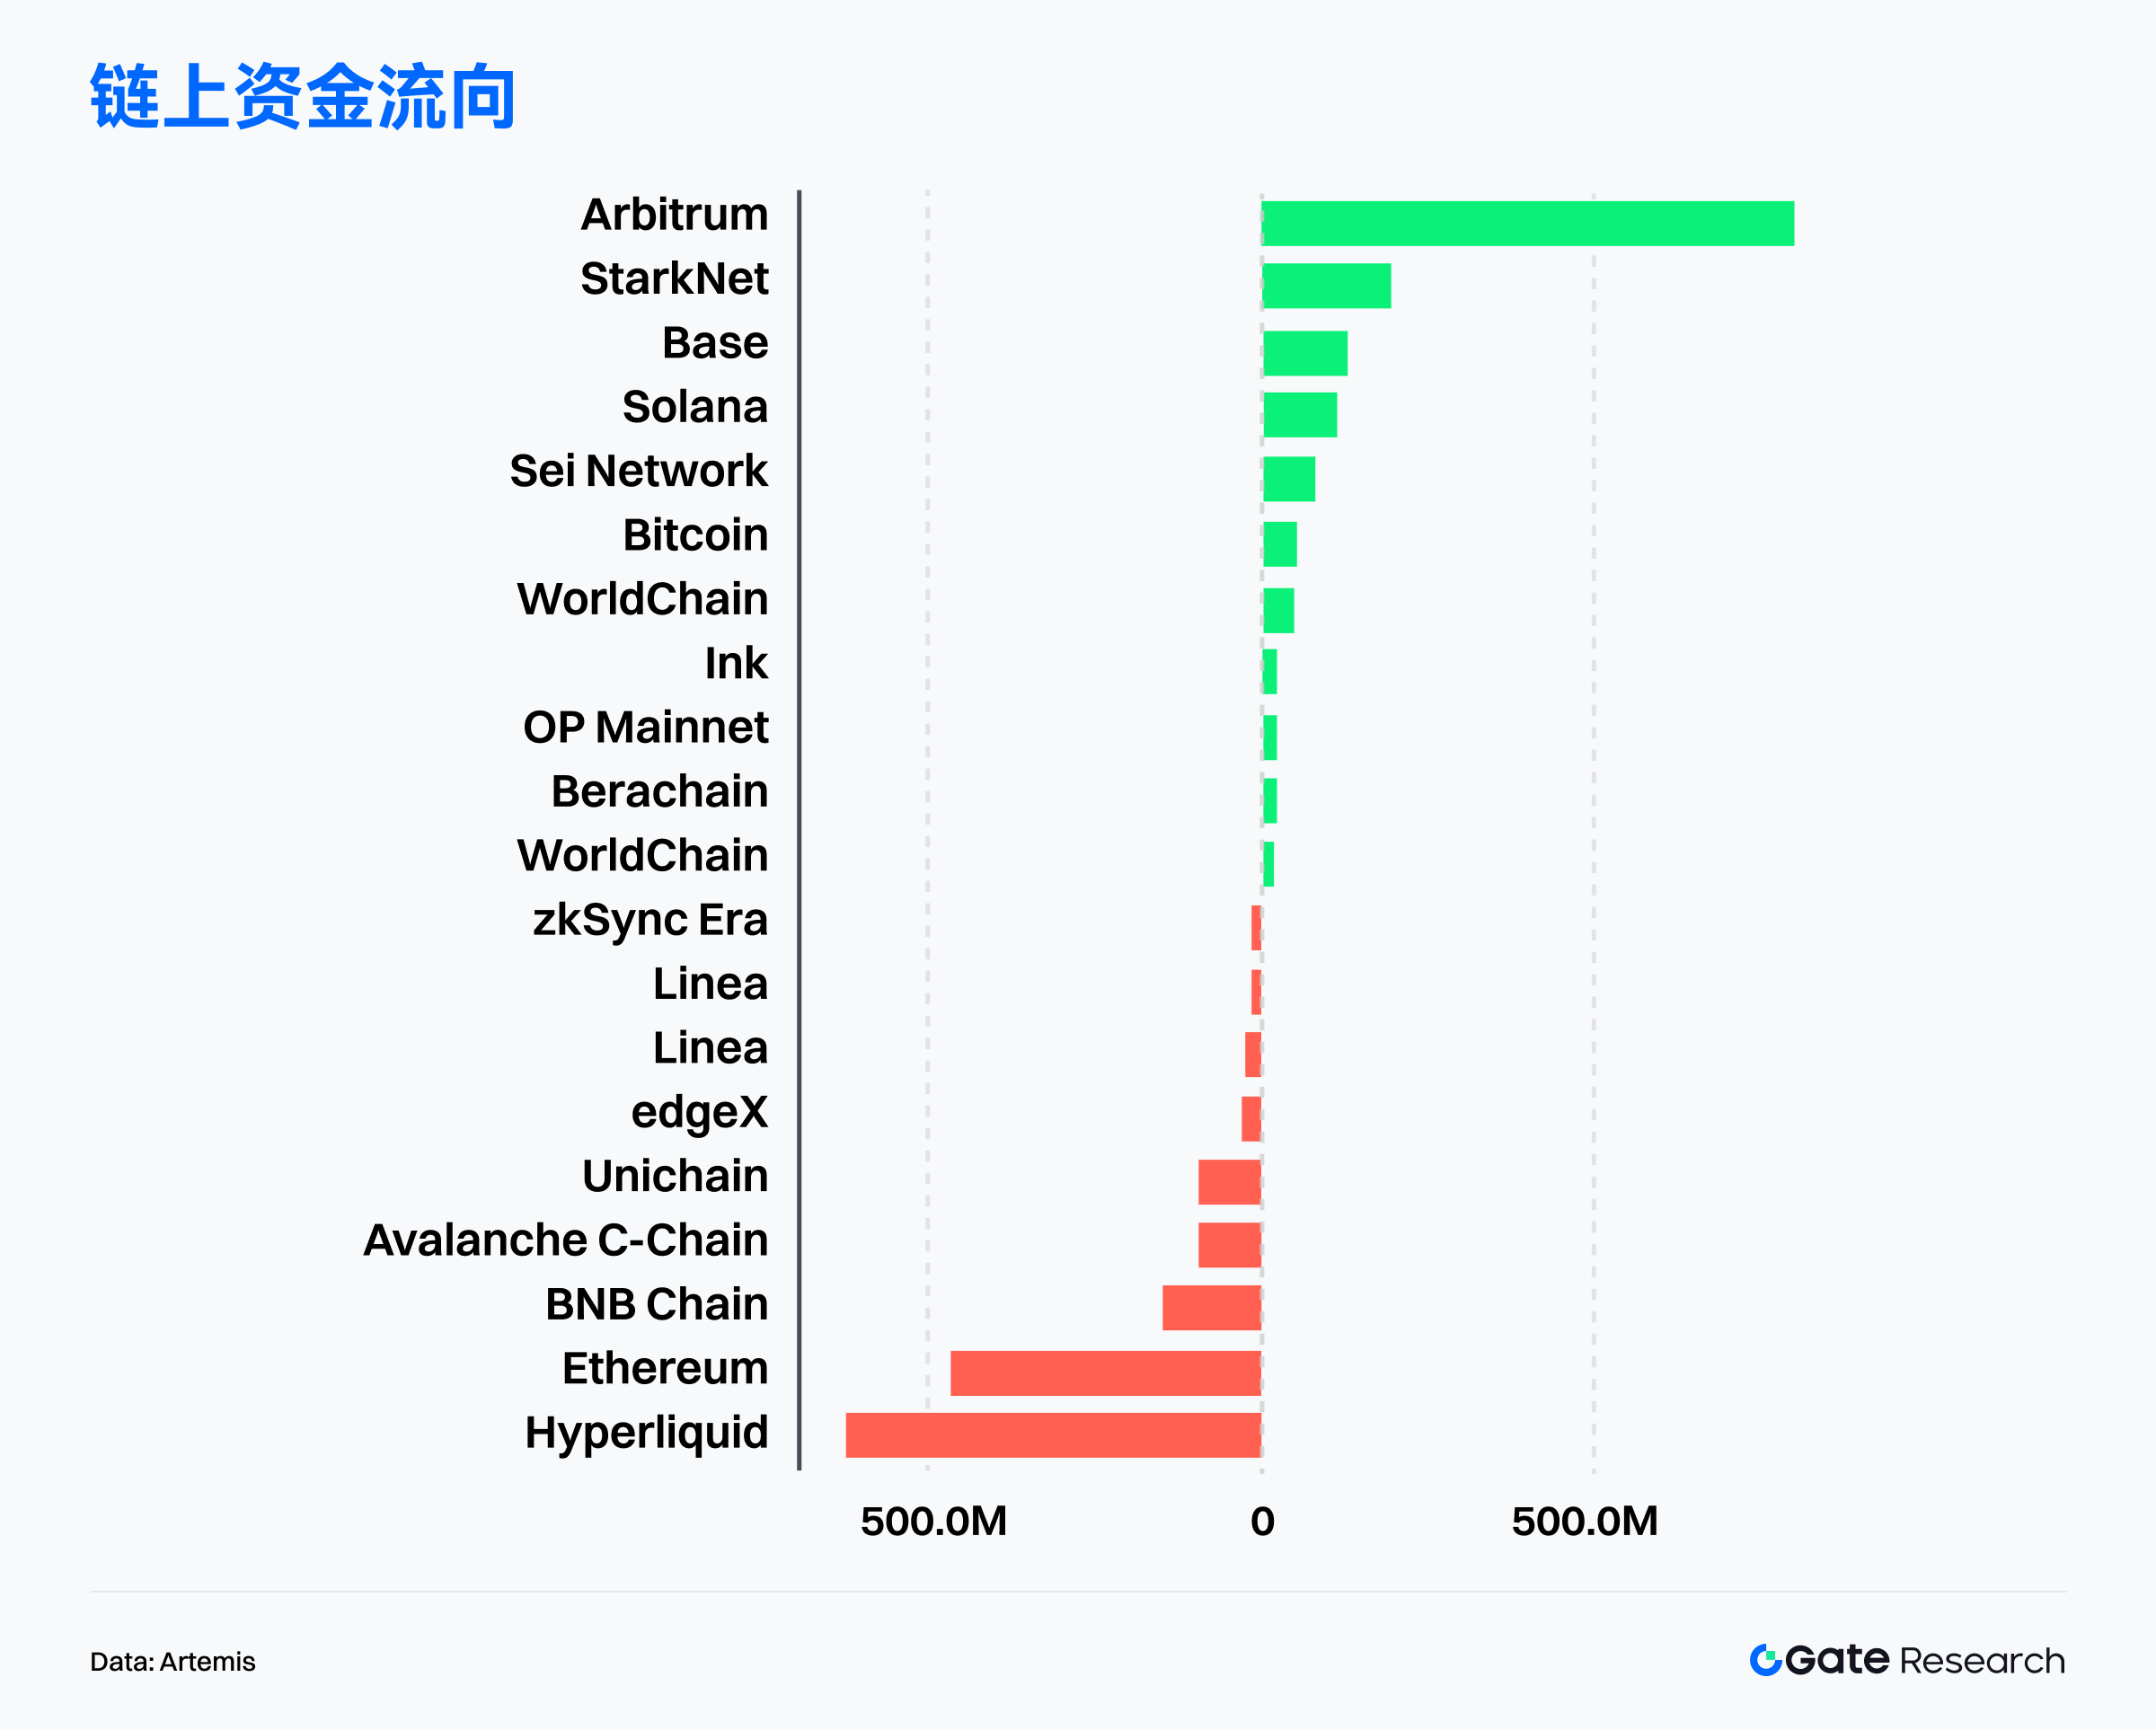
根据 Artemis 数据,近一个月链上资金流向呈现显著分化,高成长性 Layer2 与新兴公链持续获得增量,而部分高估值主链则出现较大规模外流。其中,Arbitrum 以远超其他公链的净流入规模稳居第一,反映其生态在激励延续、机构化布局和金融基础设施扩展上的综合优势;Starknet、Base、Solana 与 SEI 等生态亦录得正向流入,显示市场资金偏好具备扩张动能与叙事延展性的项目。【4】
Arbitrum 的资金吸引力来自多线加速:Robinhood 将其作为受监管证券代币化核心发行层,链上代币化资产规模逼近千万美元,真实交易循环成型;Deblock、BlockControl、Hermes 等机构级基础设施密集部署,使其定位从“DeFi 链”提升为“跨链流动性和资产结算枢纽”;USDC、USDT 供应双双上涨,跨链桥 ETH 库存创新高,链上资金承载能力持续增强。
Starknet 在 BTCFi 叙事驱动下同样表现突出:BTC 质押规模快速累积,多条 BTC 资产路径落地,使其向“比特币收益层”加速靠拢;STRK 质押体系与验证者结构成熟,超 10 亿 STRK 参与质押,网络安全性与经济模型趋稳;DeFi 生态与消费级应用并行增长,依托账号抽象的应用场景推动用户规模破百万。
相对之下,Hyperliquid、以太坊主网、BNB Chain、Avalanche 等此前高热度生态则普遍出现大额净流出,显示资金从高估值生态撤出,转向成长弹性更高、叙事更强的公链板块。整体而言,市场已进入“结构性轮动 + 风险再定价”阶段,资金集中流向叙事确立、用户增长稳健且具扩展空间的链上生态。
比特币关键指标分析
11 月加密市场在过度杠杆累积下加速下行,全月下跌 17.5%,创今年最大单月回调,风险资产整体承压。在经济数据走弱与联储偏鸽表态的背景下,12 月降息概率已回升至逾 80%。BTC 与 ETH 上周虽分别收复 9 万与 3,000 美元,但成交量明显缩减,显示反弹动力有限;机构资金观望情绪未退,比特币现货 ETF 流入疲弱,结构性需求仍处低迷区间。
在此背景下,链上数据呈现出更具结构性的信号,BTC 仍运行在多核心成本线之上,整体风险指标维持中性偏强,显示主趋势尚未被破坏,但上方筹码密集区依旧构成短期阻力;与此同时,已实现亏损指标显著回升,表明市场正经历情绪出清与高位抛压交织的阶段性调整,短线资金的承接意愿仍偏谨慎;而在更长周期维度,长期持有者的利润率持续下滑并出现净减持迹象,反映部分早期筹码进入兑现阶段,市场结构从惯性上行转向趋势换手与周期降温。
BTC 跌破短期与活跃投资者成本线,风险指标转向中性偏弱区间
根据 Glassnode 数据,BTC 最新价格已跌破短期持有者成本(STH Realized Price)与活跃投资者均值(Active Investor Mean),显示短线资金开始进入浮亏区间,市场情绪由中性偏强转向中性偏弱。黄色与红色两条成本线自下而上构成的短期支撑带被有效跌破,意味着短期买盘动能趋弱,市场进入压力主导的结构阶段。【6】
同时,BTC 价格虽仍位于真实价格(Realized Price)与市场真实均值(True Market Mean)之上,但两者间的乖离正在收敛,反映市场动能从上升阶段进入消化与换手周期。若价格持续在活跃投资者均值下方运行,短线资金的风险偏好可能继续收缩,使行情向市场均值或真实价格区域靠拢。
多周期 ATH 成本线仍位于现价上方,表明长周期结构并未遭到破坏,BTC 仍处于牛市区间的大框架内。然而,在短期成本线被跌破的背景下,市场更可能演化为高位震荡与筹码重新分布阶段。后续若 BTC 能重新站回短期持有者成本之上,将有助于恢复短线强势结构;反之,若继续在成本线下方徘徊,修正压力将进一步加大。整体来看,风险指标组合显示 BTC 已从中性偏强转为中性偏弱的再平衡阶段,短期承压但中期趋势仍未被破坏。

BTC 已实现亏损回升,市场进入情绪出清与高位压力交织阶段
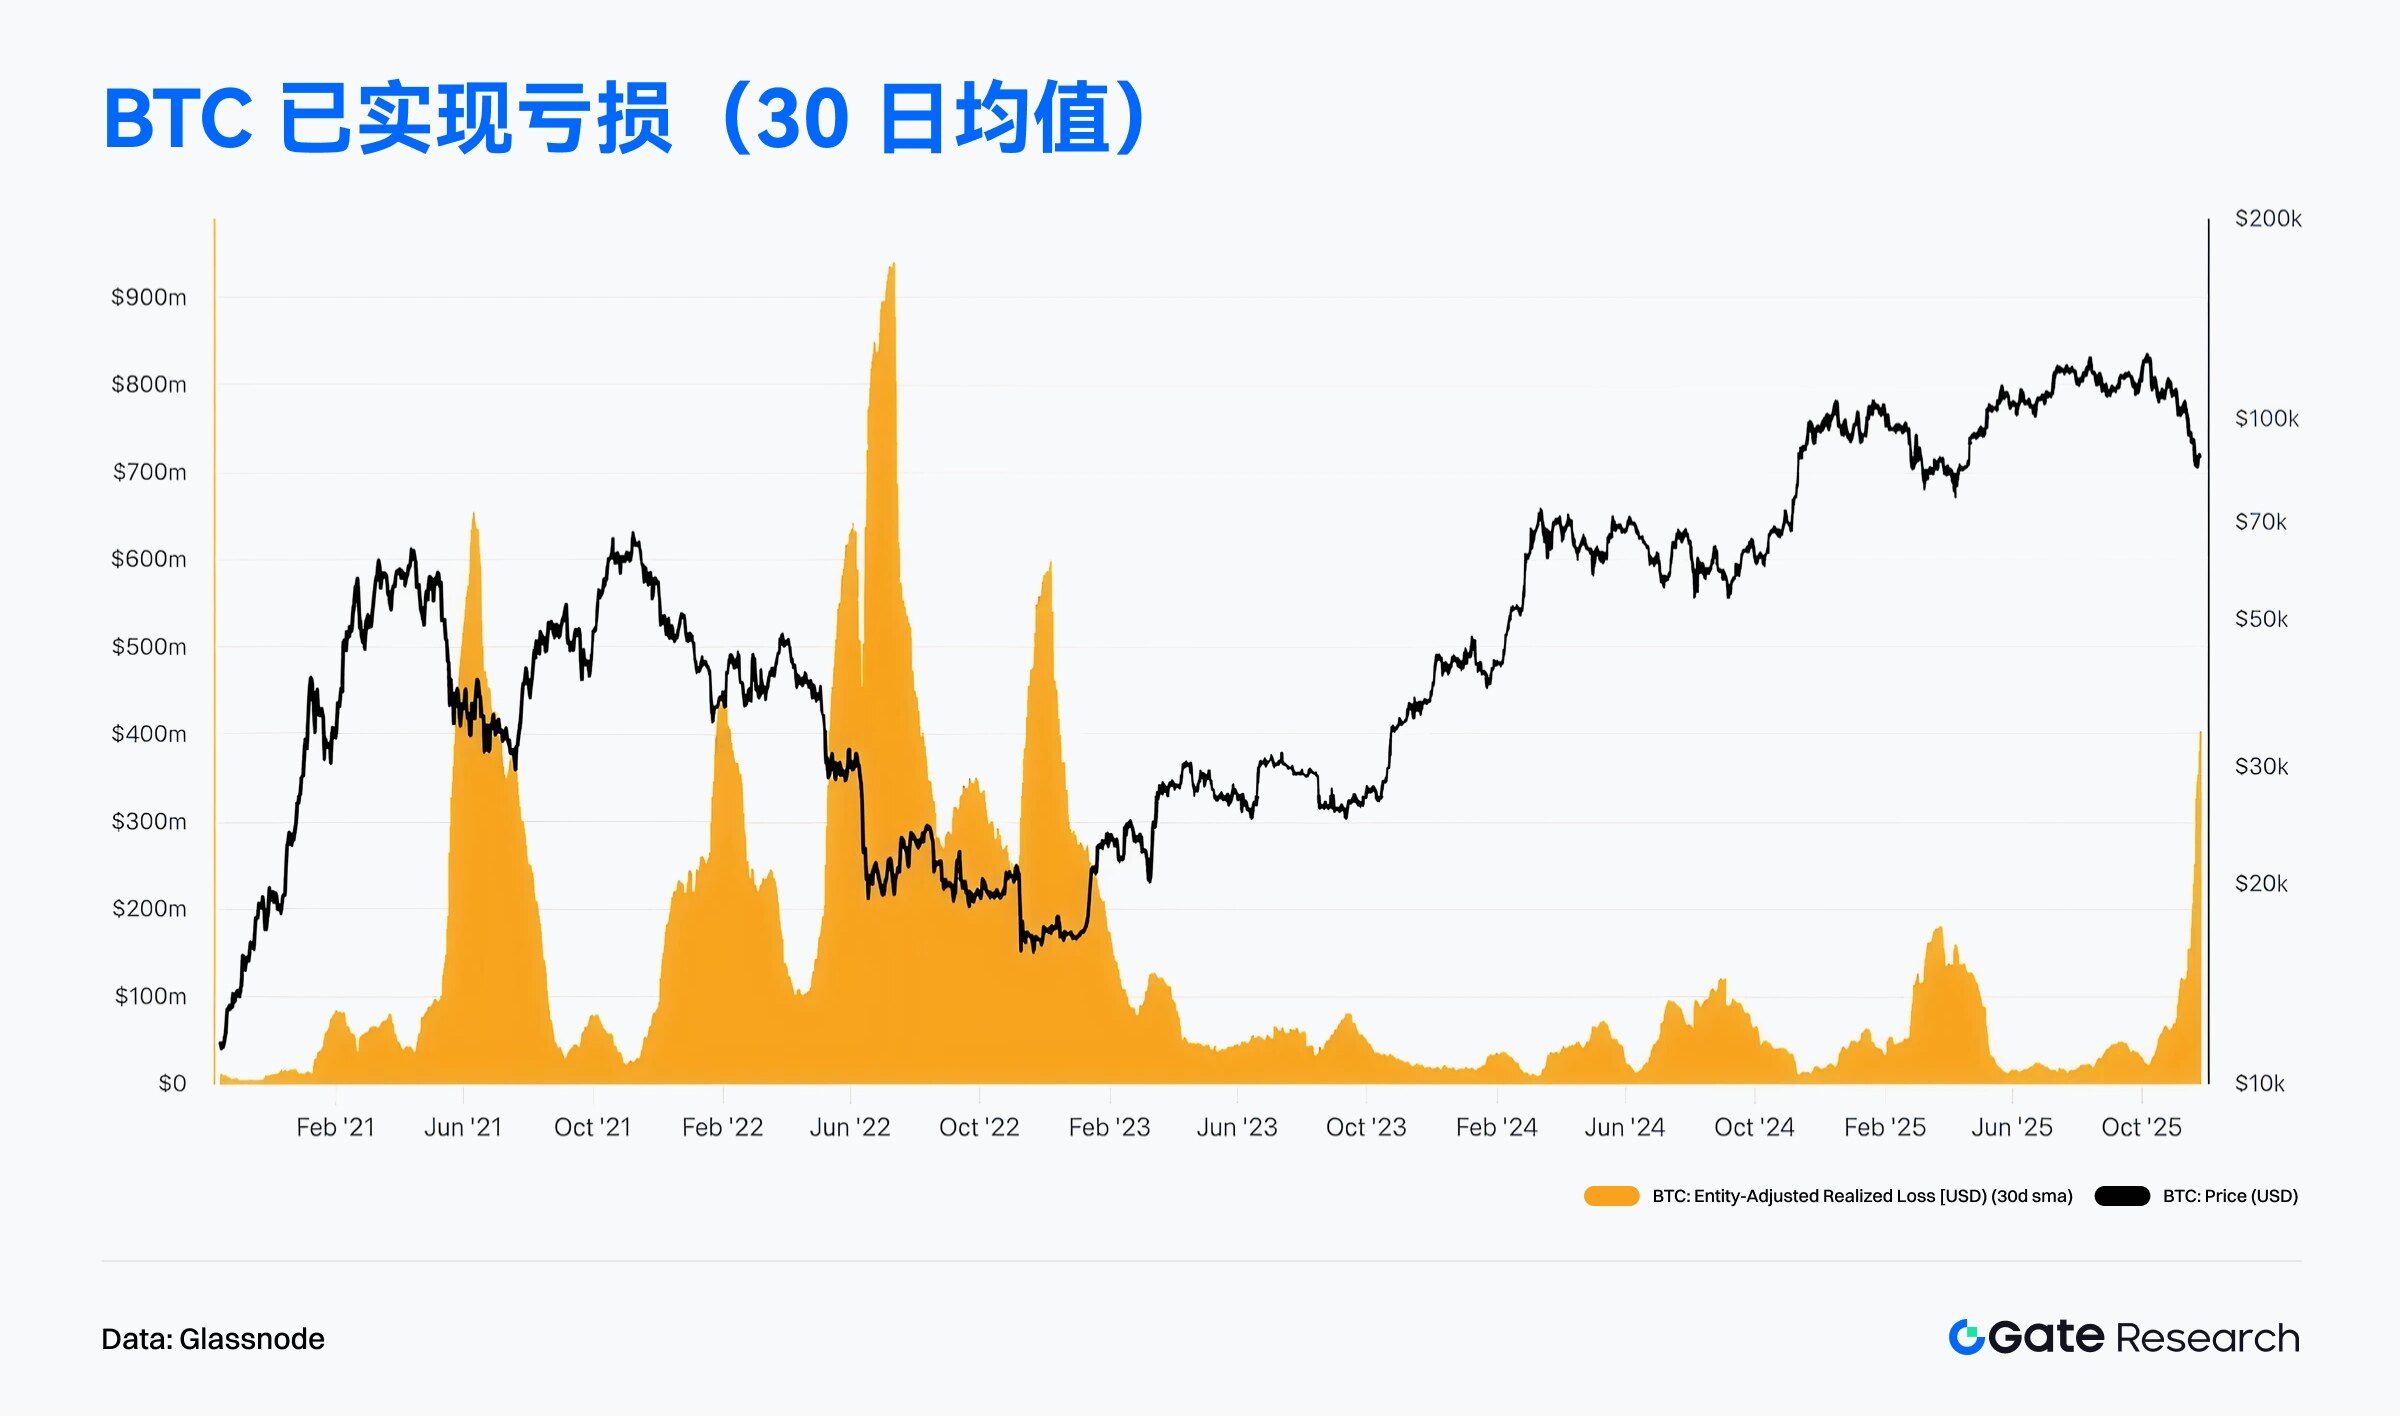
根据 Glassnode 数据,实体调整已实现亏损(30 日均值)于 11 月期间该指标显著放大,呈现由低位快速上升的陡峭结构,反映近期价格震荡下行阶段出现集中且持续的卖出亏损。这一走势与历史高波动区段具有相似特征:过去每次出现大规模亏损释放,通常对应短线持有者被动止损、杠杆抬升后的清算压力、情绪性抛售等行为的同步出现。当前亏损规模虽未达到 2021、2022 年的极端峰值,但明显高于 2023–2024 年的常态水平,说明市场进入短期调整周期,投机仓位正在经历主动或被动的去杠杆过程。【7】
尽管亏损扩大代表短期承压,但从周期结构来看,高位区间的亏损释放本质上属于多头情绪修正,可视为价格回调中的“风险吸收”阶段。与历史走势相比,若已实现亏损在随后的 1–3 周出现快速回落,通常意味着市场完成短期换手,价格有望重新回到趋势结构;反之,若亏损指标持续维持高位并伴随成交量放大,则需警惕卖压链式放大,推动 BTC 进一步回测更深支撑区。整体来看,11 月的亏损扩张显示市场短期波动增强,但并未破坏中期多头格局,其更像是上涨周期中的必要修正,为下一阶段趋势延续做准备。
BTC 长期持有者利润率下滑,市场进入趋势换手与周期降温阶段
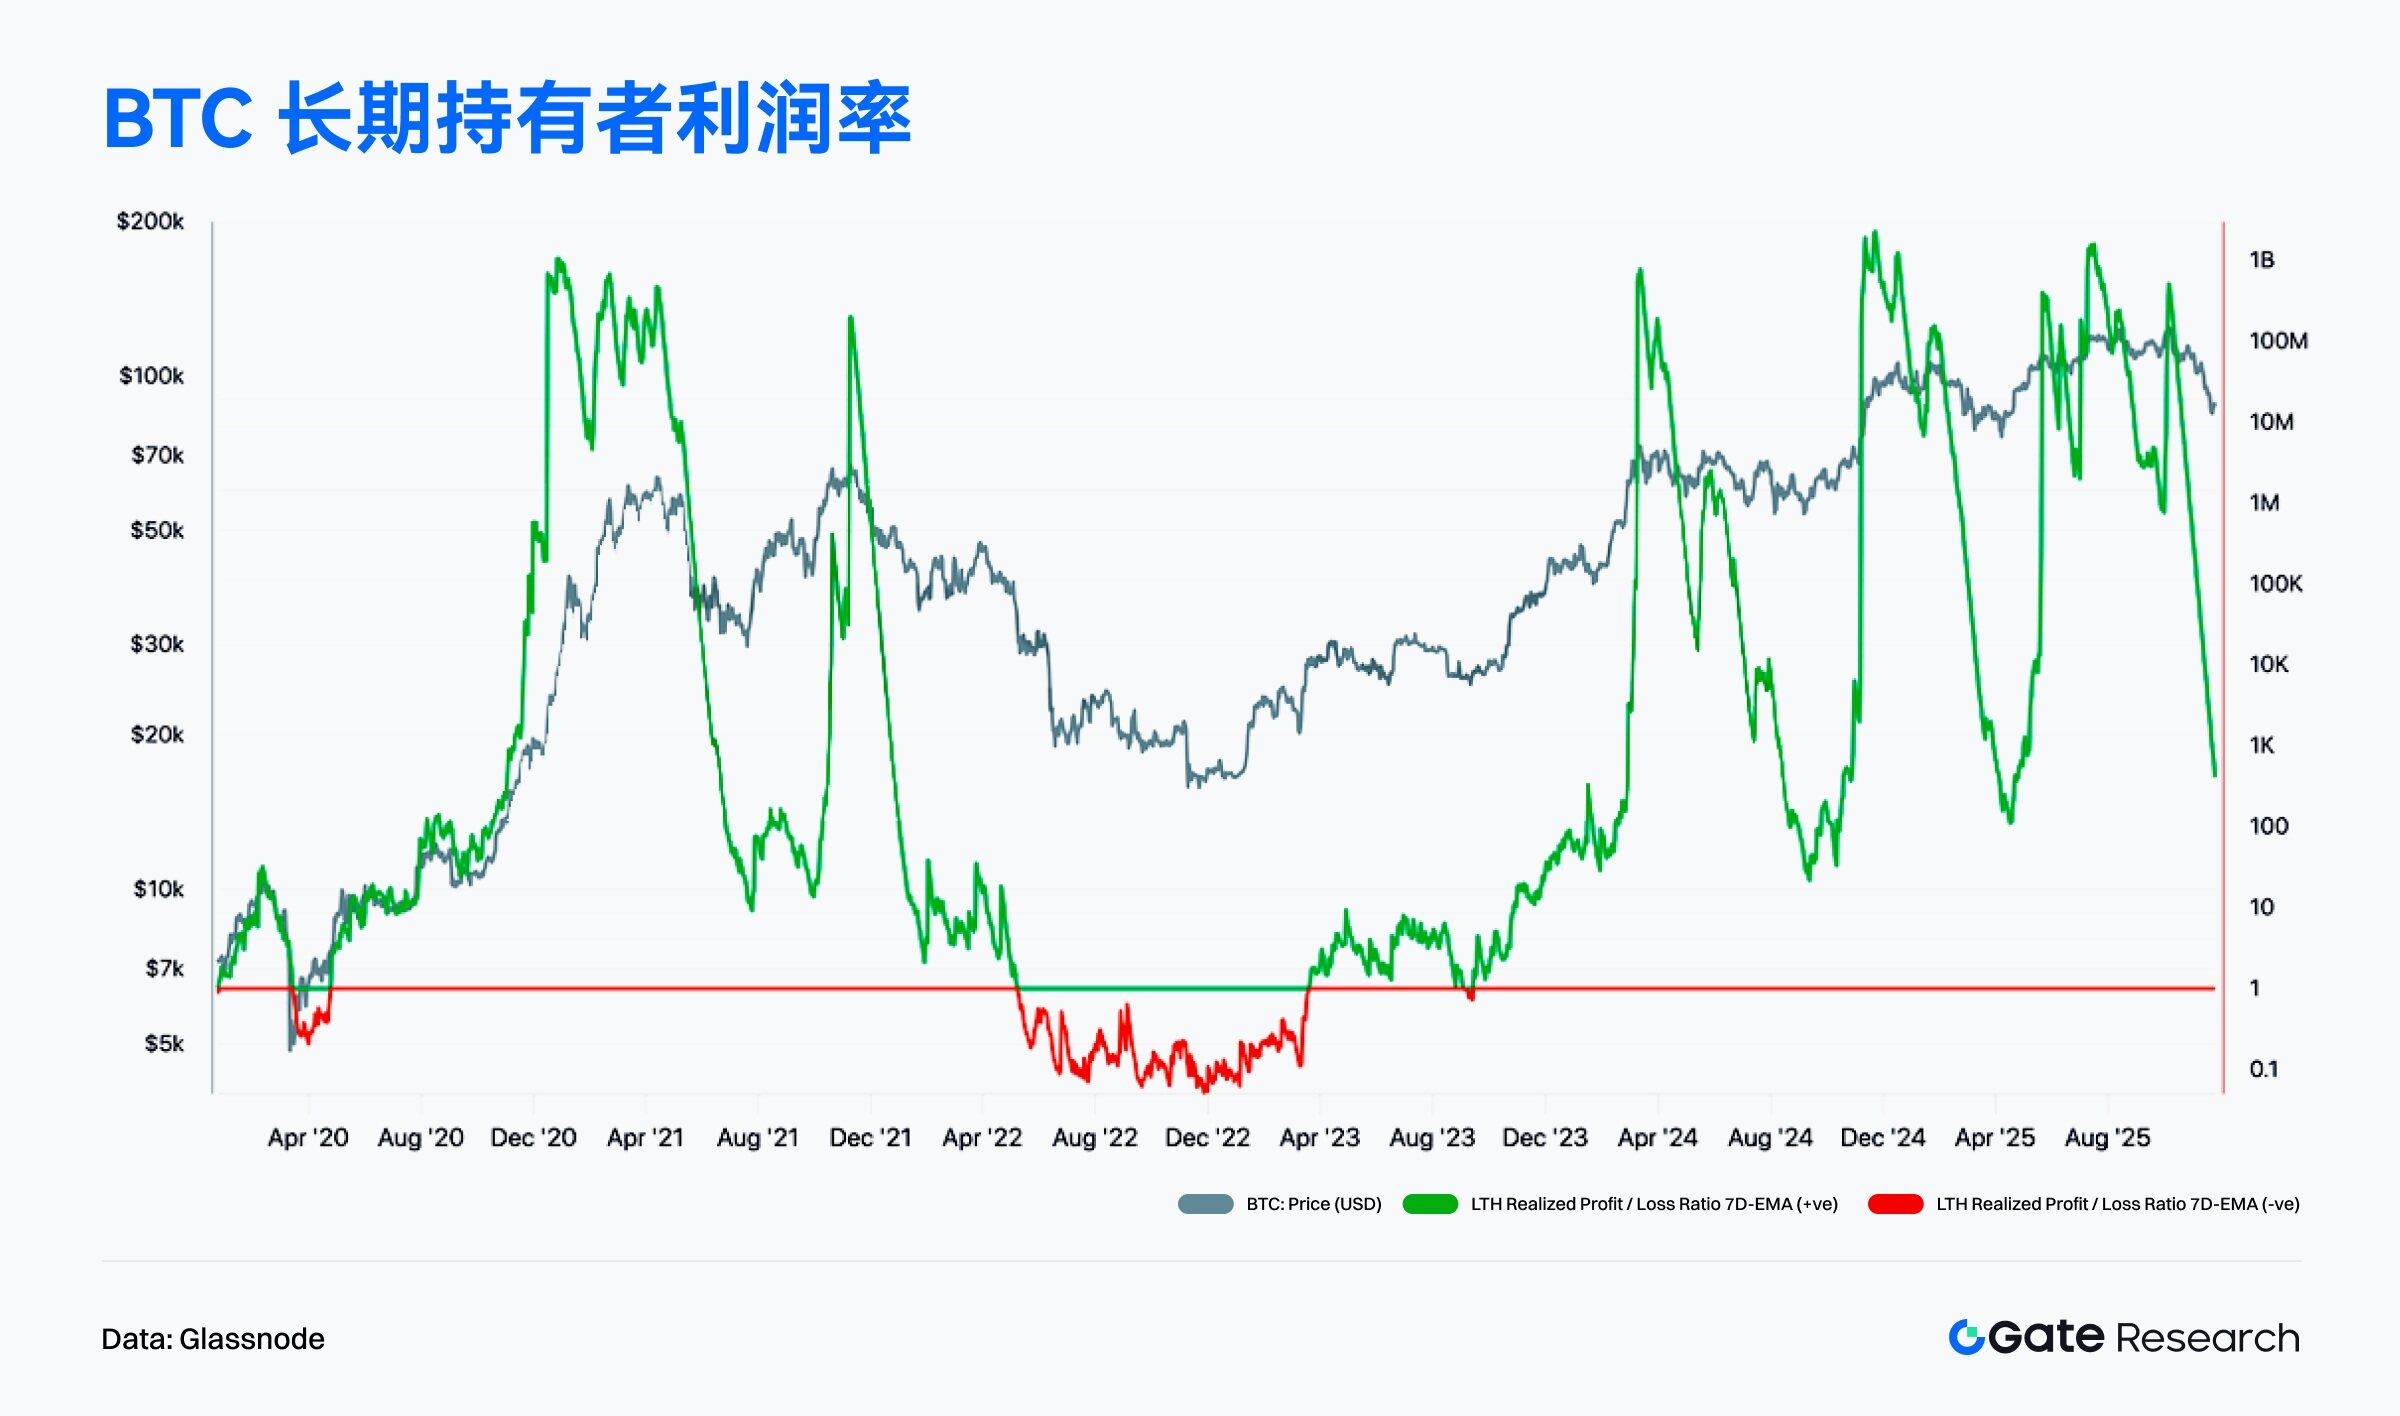
据 Glassnode 数据,长期持有者实现利润/亏损比率(LTH Realized Profit/Loss Ratio)11 月区间出现明显下行转折,指标从高位大幅回落,反映长期资金的获利空间收窄,部分持币者开始在价格疲弱时兑现收益。历史上,该指标的快速下降通常与周期顶部后的情绪降温相伴,代表早期布局者的利润正在被市场波动侵蚀。在价格仍处高位震荡的背景下,LTH 端的盈利能力减弱,显示强势趋势的延续性开始受到考验,市场进入“趋势换手 + 利润收缩”的中期修正阶段。【8】
尽管 LTH 利润比率回落明显,但从图中可见并未跌入典型熊市阶段的亏损区(红色区间),说明长期资金并未出现大规模踩踏或恐慌性亏损卖压。目前利润比仍高于关键阈值,代表市场的长期盈利结构仍在健康水平,只是边际增量趋缓。若后续比率企稳并重新上行,通常意味着长线资金完成阶段性出清,为下一轮趋势奠定基础;但若持续下行并跌入亏损区,则需警惕市场进入更深层的周期回调。整体来看,11 月的 LTH 数据更倾向于趋势降温与健康换手,而非全面反转。
热门项目与代币动态
链上数据表明,资金与用户正在逐步向具备交互基础和应用深度的生态集中,而具备话题性与技术创新能力的项目,正成为资本追逐的新焦点。接下来本文将聚焦近期表现突出的热门项目与代币,解析其背后的逻辑与潜在影响。
热门项目数据概览
Monad
Monad 是近期链上最受关注的高性能 Layer1 公链项目,以「单线程高效 EVM」为核心技术路径,旨在在完全兼容以太坊的前提下,大幅提升执行效率与网络吞吐能力。11 月 24 日,Monad 正式上线主网并发布原生代币 MON,同时启动覆盖 22.5 万链上活跃用户的大规模空投计划,受益对象涵盖 Aave、Euler、Morpho 等借贷协议用户,Hyperliquid、Uniswap 等去中心化交易所用户,以及 Pump.fun、Virtuals 等社群与模因平台参与者,形成跨赛道、跨生态的广泛分配格局。主网上线当天,新增活跃地址超过 14 万个,链上交易量突破 266 万笔,24 小时平均 TPS 达 32.75,体现出新 L1 在启动阶段的高活跃度与稳定承载能力。【9】

在价格表现上,MON 上线后呈现典型的“卖新闻效应”。受空投集中套现、ICO 份额释放与高频投机力量影响,代币在开盘短暂冲高至 0.048 美元后迅速回落至 0.022 美元附近,实现短时破发。随着 OpenSea、Pyth 预言机以及多款钱包工具同步接入,超 300 个生态应用开启可用状态,链上实测 TPS 超 5,000,首日链上交易量在半天内飙升至 4 亿美元,成为新公链发行周期中的典型高波动案例。
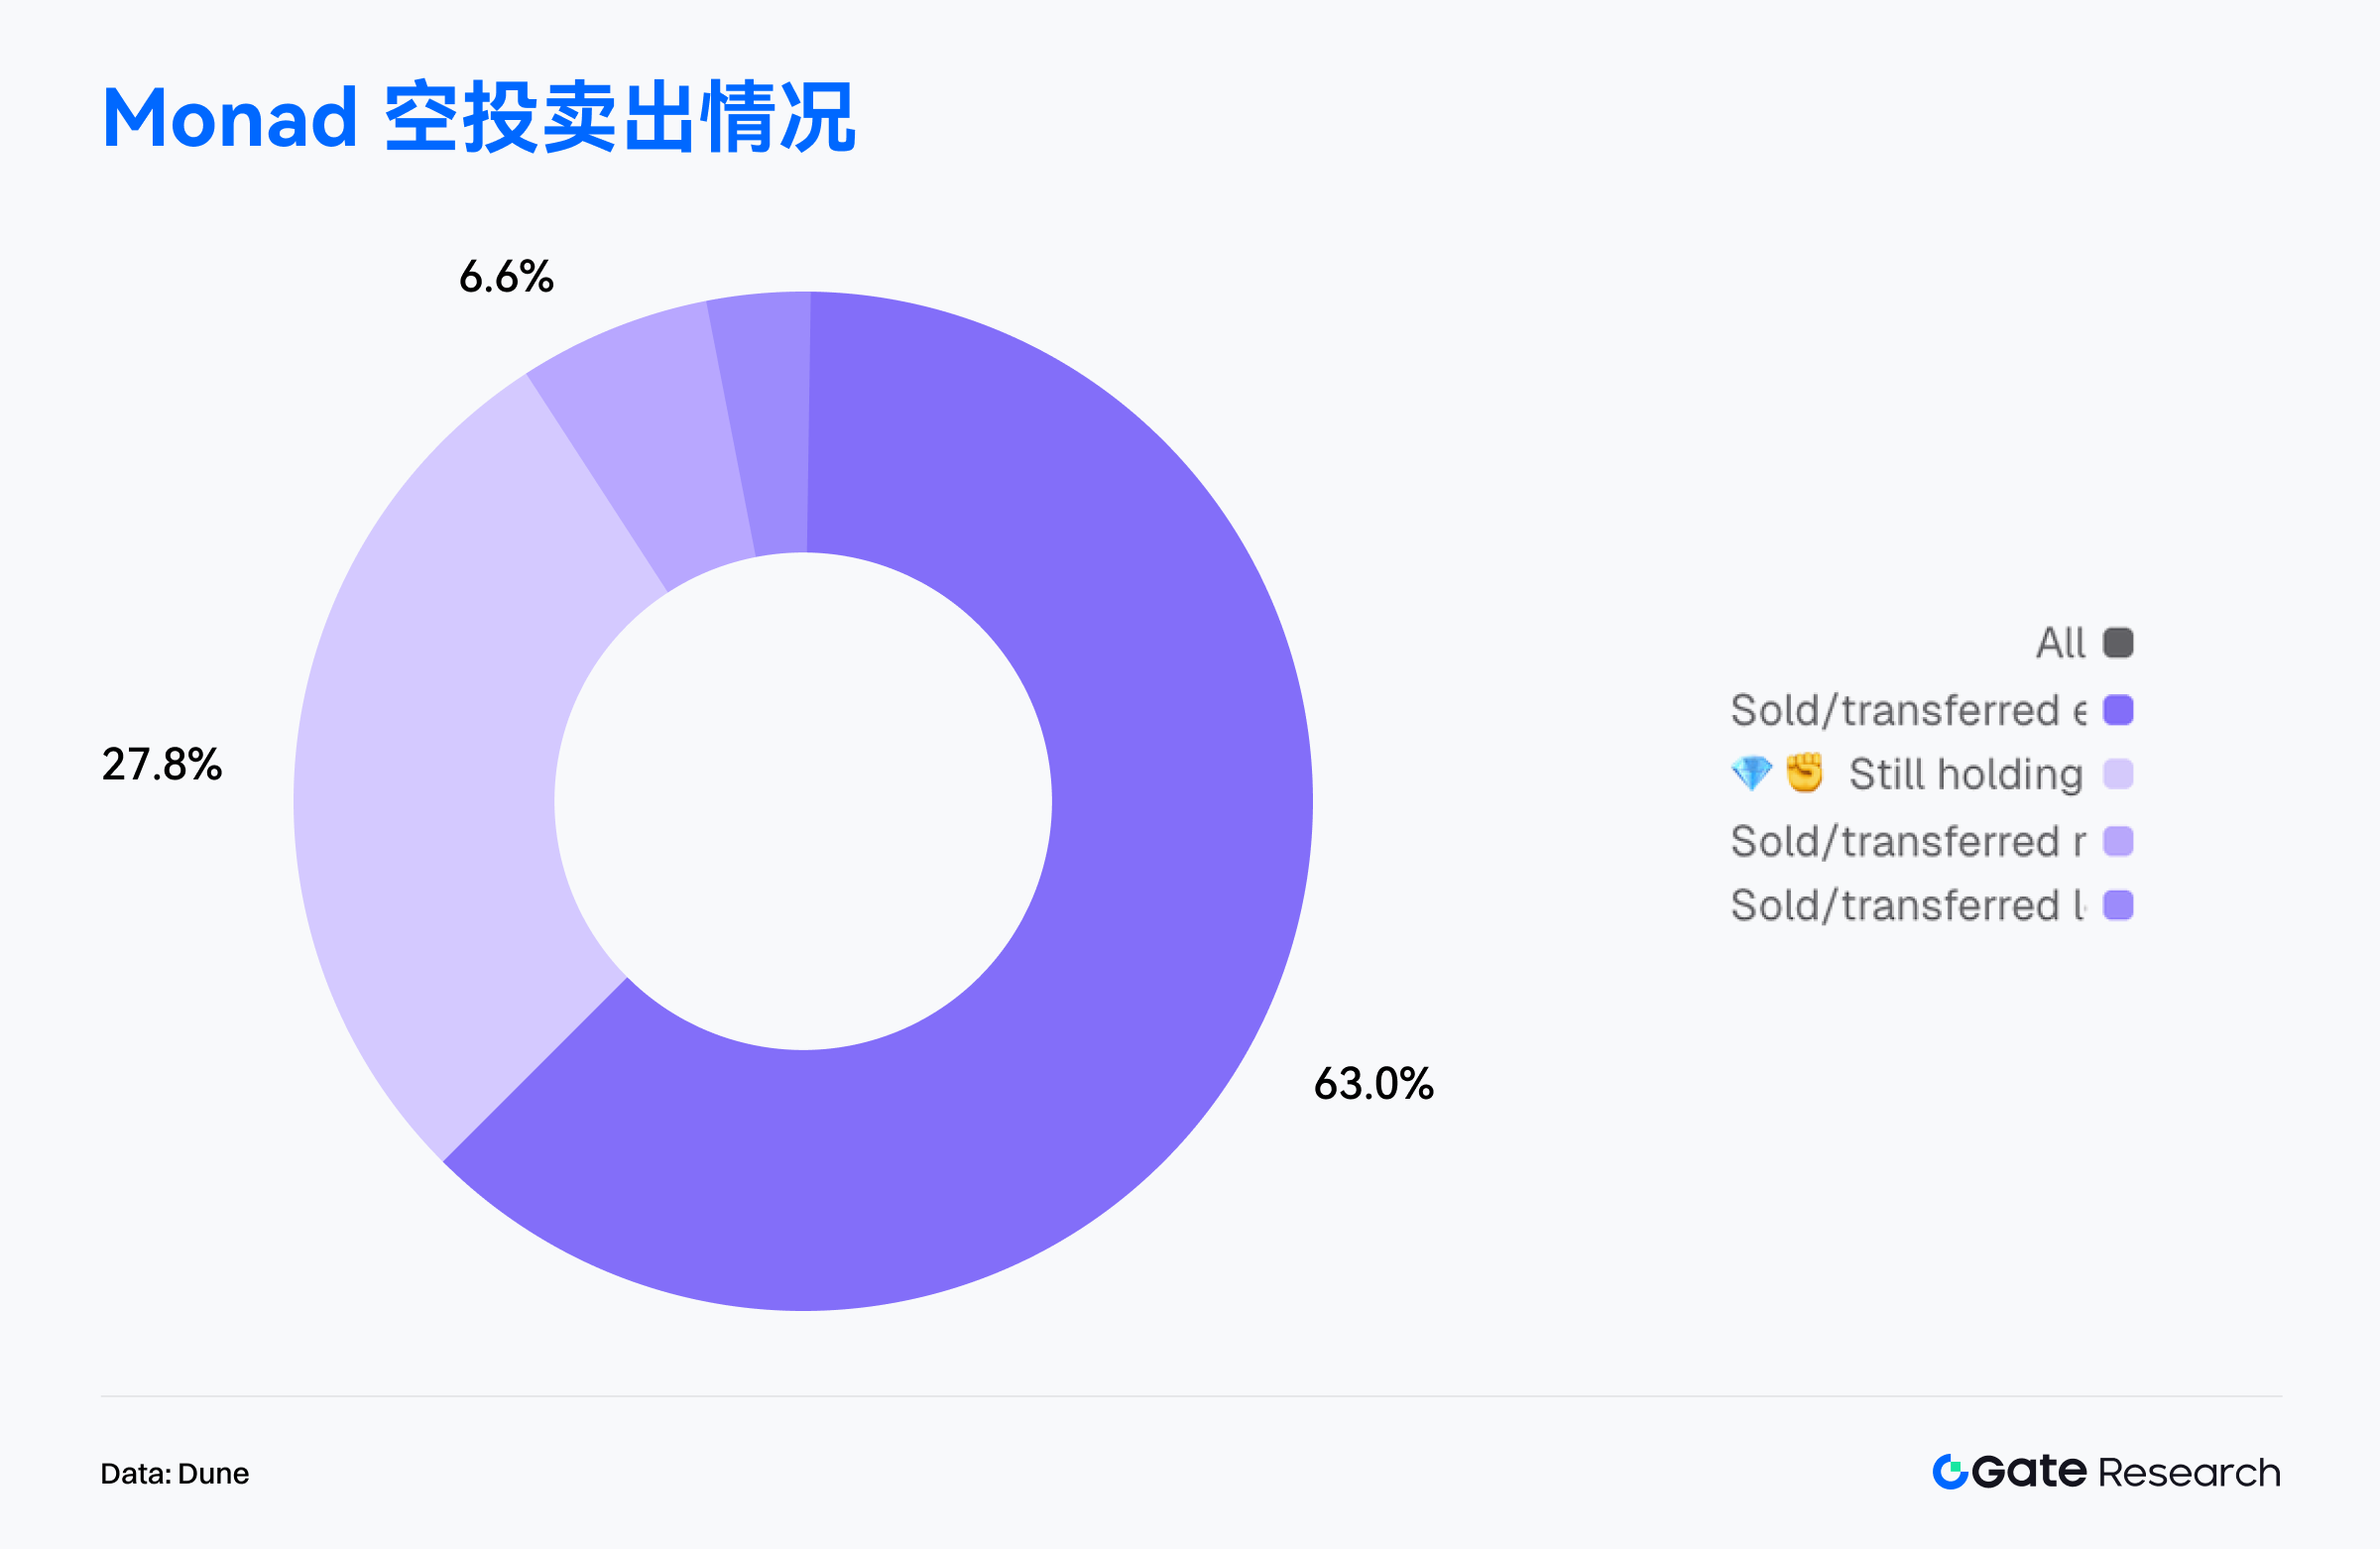
从链上钱包行为来看,空投兑现压力在早期明显占据主导。数据显示,在全部 76,021 个完成领取的地址中,有 63% 已将空投代币全部卖出或转出,成为市场主要抛压来源;27.8% 的用户选择继续满仓持有,体现出相对坚定的长期预期;另有 6.6% 的地址卖出超过一半,仅有极小部分保留少量仓位。整体来看,真正的长期持有者占比不足三成,这种高度集中的套现行为也是 MON 上线后价格剧烈波动的核心推力之一。【10】
在生态激励层面,多家项目同步推出 MON 质押与收益活动以提升流动性与用户黏性。FastLane Labs 推出 shMON 铸造质押,参与质押的 MON 已超过 1.22 亿枚;Magma 提供 gMON 流动性质押,年化收益约 15%。同时,游戏与应用生态同步启动,例如 Lumiterra 推出 100 万 MON 赛季奖池,Kuru DEX 上线平台手续费 25% 回馈计划,带动生态内的用户活跃度持续提升。
整体而言,Monad 的市场表现符合典型新 L1 的启动曲线:技术创新与高预期推升前期热度,空投与早期流动性释放导致短期价格承压;链上活跃度、生态激励与质押需求为中期网络发展提供支撑。未来 TVL 增长、开发者迁移与生态扩张,将成为衡量 MON 价格中期表现与网络长期竞争力的关键指标,标志着新一轮高性能公链竞争格局的正式展开。
热门代币数据概览
$TEL
Telcoin 是一家成立于 2017 年的跨国金融科技项目,专注将区块链技术、电信网络与数字银行服务整合,为全球手机用户提供低成本、即时且普惠的跨境汇款与数字资产服务。项目由瑞士非营利组织 Telcoin Association 管理,运营 EVM 兼容的 Telcoin Network,并由全球移动运营商通过 PoS 机制共同维护安全性。其生态中包含多签数字银行应用 Telcoin Wallet,以及正在推进的合规数字银行 Telcoin Bank,旨在构建「移动用户直达链上金融」的全球基础设施。
据 CoinGecko 数据显示,$TEL 近 30 天涨幅达 88.9%。本月强势表现与“合规金融”“链上美元”和“稳定币监管”相关叙事升温紧密相关,使资金明显自投机板块回流至具备稳健基本面的项目。【11】

在项目进展方面,Telcoin 宣布其数字银行业务与合规稳定币 eUSD 已进入正式部署阶段,定位为“银行级稳定币 + 移动端直达链上金融”的组合架构。eUSD 将由受监管的银行实体负责发行与链上铸造,成为首批由传统金融机构直接发行的链上稳定币之一。这一进展使 Telcoin 同时具备数字银行能力、稳定币发行权与开放式 DeFi 接入的完整链上金融闭环,改变了项目的商业模型与长期定位,促使市场对其价值进行明显重估。
社群与媒体层面,随着关键进展公布,Telcoin 在 X、Telegram 与 Reddit 的讨论量出现显著攀升。加密媒体普遍将其视为“银行与链上金融融合的示范案例”,并将其纳入“新型稳定币竞争”“传统金融机构上链”“移动端加密银行”等宏观叙事之内。社群情绪呈一致性乐观,形成“叙事增强 → 关注度提升 → 流动性增加”的正循环,使短期资金流入进一步强化上涨趋势。
总体而言,$TEL 本月的上涨属于典型的「基本面突破 + 合规叙事强化 + 市场情绪共振」结构行情。数字银行业务与 eUSD 稳定币的推进成为决定性利好,使 Telcoin 从跨境支付类项目跃升为“银行级稳定币 + 链上金融接口层”的综合型基础设施。若相关产品顺利落地,且合规金融叙事继续保持热度,$TEL 在经历快速上涨后仍具中期趋势延续的潜力。
总结
2025 年 11 月,Solana 凭借高频应用与强用户黏性稳居全链活跃度与交易量首位,展现出能穿越行情波动的使用韧性;Ethereum 则继续作为价值结算层的核心主链,在手续费收入上保持绝对领先,链上经济活动仍以高价值交互为主。Base 与 Polygon PoS 在中端区间稳步扩张,分别在社交应用与消费级交互领域展现持续增长动能。相较之下,Arbitrum 的交易量与活跃地址虽维持低位震荡,但资金流向显示其在资产代币化、基础设施完善及机构化布局方面具备优势,仍是本轮资金偏好的关键受益者。同时,Starknet 等新兴公链在 BTCFi 叙事推动下迅速累积动能,呈现显著的用户增长与资本吸引力。
整体来看,链上生态正从单纯的资金流动,转向由真实使用需求、应用增长路径与叙事扩散共同驱动的新阶段。高性能公链持续主导交互流量,价值型主链巩固基础层角色,而具备应用增量与叙事空间的中型与新兴生态正成为资金重新定价的焦点,链上增长结构朝多极化与分层化方向稳步推进。
在比特币方面,随着价格跌破短期持有者成本与活跃投资者均值,高位筹码开始进入更明显的重新分布阶段,显示短线结构已由强势转为承压。下方的真实价格与市场均值仍构成中长期支撑,使整体牛市框架未被破坏;但短期跌破成本线意味着部分资金进入浮亏区间,亏损释放推动换手加速,市场进入偏弱的“再定价—再平衡”过渡阶段。当前多空力量正在关键区间重新博弈,后续走势将取决于能否有效消化上方抛压,并在情绪收敛后重新形成增量需求。
项目层面,新晋高性能公链 Monad 在主网上线初期即展现强交互与高速增长潜力,惟空投兑现使其短期价格承压;Telcoin 则因数字银行与合规稳定币推进,成功从跨境支付项目跃升为链上金融基础设施代表,叙事与基本面共振带动明显重估。总体趋势显示,市场正在从单纯投机转向关注真实使用与可持续生态成长。
参考资料:
1.Artemis, https://app.artemisanalytics.com/chains
2.Artemis, https://app.artemisanalytics.com/chains
3.Artemis, https://app.artemisanalytics.com/chains
4.Artemis, https://app.artemisanalytics.com/flows
5.DefiLlama, https://defillama.com/chain/arbitrum
6.Glassnode, https://studio.glassnode.com/charts/da73676e-78a6-4880-5ca2-a227ee301230?s=1579395107&zoom=
7.Glassnode, https://studio.glassnode.com/charts/indicators.RealizedLossAccountBased?a=BTC&chartStyle=column&mAvg=30&s=1602806400&u=1764115200&zoom=
8.Glassnode, https://studio.glassnode.com/charts/btc-lth-realized-plratio?s=1577318400&u=1764115200&zoom=
9.Dune, https://dune.com/hashed_official/monad-overview
10.Dune, https://dune.com/counterparty_research/monad
11.CoinGecko, https://www.coingecko.com/coins/telcoin
Gate 研究院是一个全面的区块链和加密货币研究平台,为读者提供深度内容,包括技术分析、热点洞察、市场回顾、行业研究、趋势预测和宏观经济政策分析。
免责声明
加密货币市场投资涉及高风险,建议用户在做出任何投资决定之前进行独立研究并充分了解所购买资产和产品的性质。 Gate不对此类投资决策造成的任何损失或损害承担责任。
免责声明:本文章仅代表作者个人观点,不代表本平台的立场和观点。本文章仅供信息分享,不构成对任何人的任何投资建议。用户与作者之间的任何争议,与本平台无关。如网页中刊载的文章或图片涉及侵权,请提供相关的权利证明和身份证明发送邮件到support@aicoin.com,本平台相关工作人员将会进行核查。


