Key Turning Point for Bitcoin: This Week's Closing May Determine Bullish or Bearish Direction

CN
2 hours ago

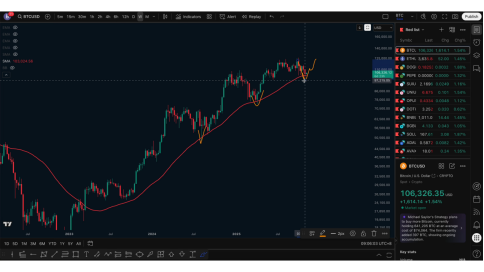
Last week, we focused on the closing situation of Bitcoin's weekly chart.
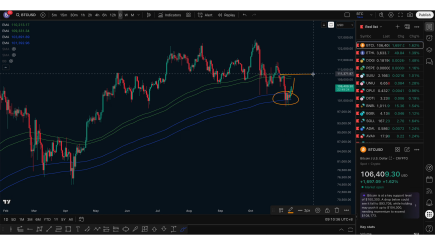
The results showed that Bitcoin's weekly close was above the 50-week moving average, closing at 104,500, while the current 50-week average is around 100,300.

This moving average serves as the dividing line between bullish and bearish trends on the weekly chart.
If the price falls below 100,300, the trend may shift from bullish to bearish;
however, the current price is stabilizing above 106,000, indicating some rebound strength.

If this week's weekly chart can continue to close positively,
then the mid-term decline adjustment that started from 122,000
is likely to come to an end.

Bitcoin Key Turning Point: This Week's Close May Determine Bullish or Bearish Direction_aicoin_Image1

Short-term Structure Observation

On the short-term, the daily chart has closed positively for two consecutive days,
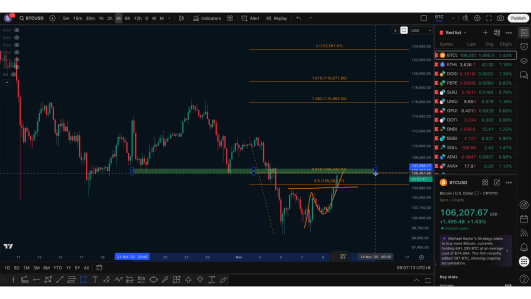
and a reversal structure with a higher bottom and neckline breakout has appeared on the 4-hour chart.
This indicates that short-term funds are making tentative rebound moves.

However, both the weekly and daily charts still lean bearish,
and the structure has not fully reversed,
so it is recommended to remain cautious and not rush to enter the market at this stage.


Key Price Range

Support below: 104,500-105,000

Resistance above: 106,500-107,000

This range is a key pressure zone and also the 0.618 retracement level.

Bitcoin Key Turning Point: This Week's Close May Determine Bullish or Bearish Direction_aicoin_Image2

If the price encounters resistance and falls back here, then stabilizes and rebounds after retesting the neckline,
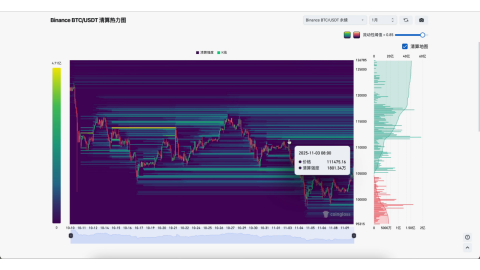
the next target may look towards around 111,000,
which is a concentrated liquidation area for bears.
Once broken, there may be a possibility of accelerated upward movement in the short term.

Bitcoin Key Turning Point: This Week's Close May Determine Bullish or Bearish Direction_aicoin_Image3

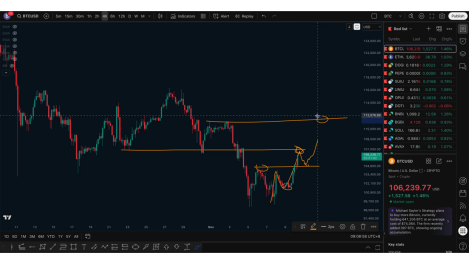
However, before the structure is confirmed,
it is not advisable to chase shorts or longs at high levels.
The most rational strategy is to wait for confirmation after a support retest before participating.

Bitcoin Key Turning Point: This Week's Close May Determine Bullish or Bearish Direction_aicoin_Image4


Ethereum Trend

Ethereum's rebound structure is similar,
with resistance above around 3,700.
If it can break through and confirm with a retest,
the short-term target is expected to look towards the 3,900-4,000 range.

Conversely, if 3,700 encounters resistance and falls back,
one should continue to maintain a cautious outlook.


Mid-term Trend and Sentiment

From the daily Vegas channel perspective,
Bitcoin has gained support and rebounded in the second channel,
with the upper first channel around 110,000,
which is also an important area where previous support turns into resistance.

Bitcoin Key Turning Point: This Week's Close May Determine Bullish or Bearish Direction_aicoin_Image5

If this week can close above the 50-day moving average and close positively,
it would indicate that the mid-term adjustment phase may be coming to an end.

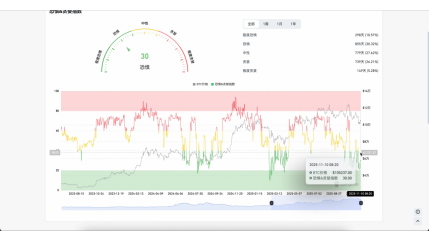
Additionally, the current fear and greed index is below 40,

Bitcoin Key Turning Point: This Week's Close May Determine Bullish or Bearish Direction_aicoin_Image6

Market sentiment is leaning bearish, with fear dominating.
Historically, such phases are often accompanied by short-term rebounds.

Follow me for progress together. The article is published with a delay and is for reference only.

Bitcoin Key Turning Point: This Week's Close May Determine Bullish or Bearish Direction_aicoin_Image7

免责声明:本文章仅代表作者个人观点,不代表本平台的立场和观点。本文章仅供信息分享,不构成对任何人的任何投资建议。用户与作者之间的任何争议,与本平台无关。如网页中刊载的文章或图片涉及侵权,请提供相关的权利证明和身份证明发送邮件到support@aicoin.com,本平台相关工作人员将会进行核查。

Share To
APP

X

Telegram

Facebook

Reddit

CopyLink