11.6 Market Analysis, Important Structure Analysis of Bitcoin, Take a Quick Look

CN
9 hours ago

Today we will do a periodic market summary.

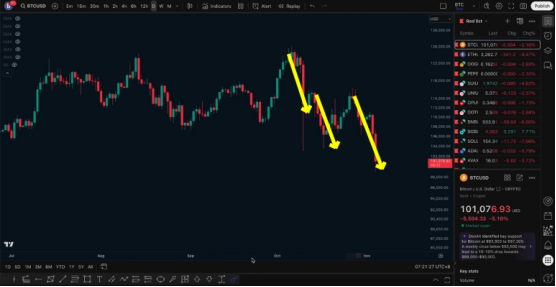
During this time, we participated in three complete rounds of a downward market:

11.6 Market Analysis, Important Structure Analysis of Bitcoin, Preview_aicoin_Image1

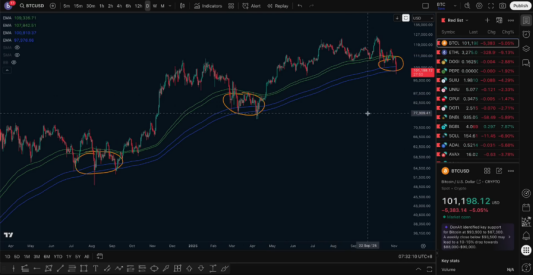
In the first phase, we saw a bearish trend from 122,000 down to below 105,000, with the lowest point at 103,000, and we successfully captured this short position.
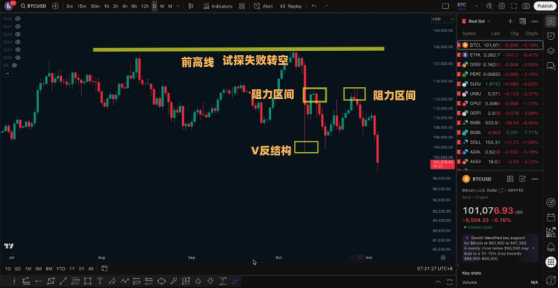
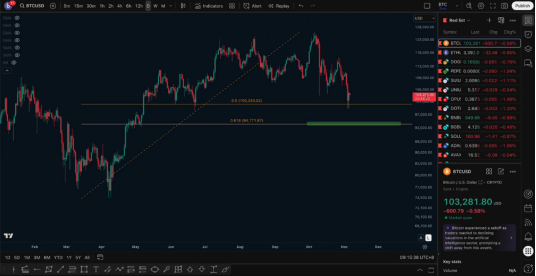
In the second phase, after a slight rebound at the bottom, when it rebounded to the 0.5-0.618 range, we indicated that this was a pressure zone and suggested laying out short positions, targeting the previous low.

11.6 Market Analysis, Important Structure Analysis of Bitcoin, Preview_aicoin_Image2

In the third phase, last week's rebound also reached the 0.5-0.618 range. We set 117,500 (0.618) as the defense point and stop-loss for the short position, laying out short positions again, targeting the 103,000-100,000 range, and expecting to break below the integer level of 100,000. Ultimately, the market did indeed fall below this position.

In fact, I clearly stated ten days ago: the bearish target is 100,000.
In the following days, I continued to track this viewpoint. Two days ago, I emphasized again that 100,000 must be broken; a day ago, I indicated that the market would experience a sharp decline. Yesterday, we conducted a comprehensive analysis from a larger cycle perspective, so I will not repeat it today.

Next, let's focus on "what to do."

Many people will try to place long orders to bet on a rebound when the integer level of 100,000 is broken.
This approach is understandable, but it is essential to control risk. After the integer level is broken, there is often an expectation of a brief rebound, but whether the rebound can form a reversal is uncertain.

So, betting on a bottom rebound at the 100,000 level actually carries considerable risk, and I personally do not recommend it. In a bearish trend, we should try to only engage in one-sided trading. Rebound long positions can be abandoned; there is no need to try to catch everything.

Trading requires trade-offs; if you want to profit from the bearish trend while also trying to catch a rebound, it is easy to fall into fatigue and emotional trading. Once the rhythm is disrupted, the risk will amplify.

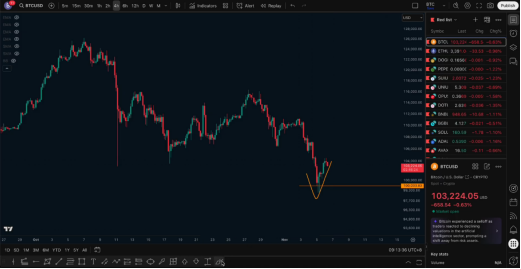
Therefore, trade only in the direction of the trend. Currently, after the market broke below the integer level of 100,000, a brief V-shaped rebound at the bottom has occurred.

11.6 Market Analysis, Important Structure Analysis of Bitcoin, Preview_aicoin_Image3

However, from a structural perspective, a reversal has not yet formed here. Although 100,000 is a short-term support level, it has not been validated multiple times. If it is merely a weak rebound, it is insufficient to determine a reversal. Only when the price forms a bullish structure in this area can it potentially drive a rebound or even a reversal.

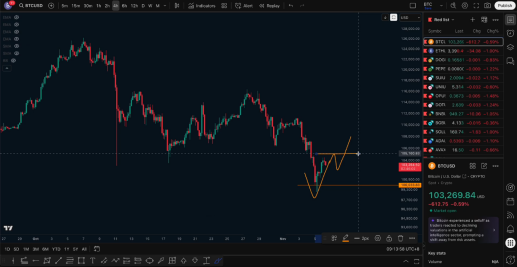
If a bullish structure appears on the 4-hour level, it can be considered a phase reversal; however, it is important to note that this reversal may only be a healthy pullback within the daily level.

11.6 Market Analysis, Important Structure Analysis of Bitcoin, Preview_aicoin_Image4

A true trend reversal requires a multi-period resonance reversal structure to form simultaneously on both the 4-hour and daily levels to be confirmed. The current rebound resembles a healthy adjustment phase within a bearish trend, similar to the previous adjustment.

Therefore, after the rebound, short positions can still be considered for entry; long-term short positions can continue to be held.

Previously, we mentioned that the bearish target is in the 103,000-100,000 range, and it may even break below 100,000.
But this does not mean that short positions should exit immediately, as there are currently no signals of a bottom reversal.

Next, let's look at the next target.

From a weekly perspective, if the price breaks below the 50-week moving average, the trend will undergo significant changes.

11.6 Market Analysis, Important Structure Analysis of Bitcoin, Preview_aicoin_Image5

Currently, the price is between 103,000 and 102,000. If this week closes below this range, it means that the 50-week moving average has been effectively broken, and the market may shift from a weekly bullish to a bearish trend.

11.6 Market Analysis, Important Structure Analysis of Bitcoin, Preview_aicoin_Image6

If the trend continues to extend, the next round of bearish targets will retest the 0.618 key position of the previous upward movement, which is around 94,000.
Therefore, the short-term target for short positions can be aimed at 94,000, while long-term short positions can still be held.

If a reversal signal appears on the 4-hour level afterward, we will make specific judgments. Overall, the current structure still leans bearish.

Thus, the strategy should focus on laying out short positions at high points after a rebound, without overly speculating on where the bottom might be. Remember one thing: trading should be based on objective price behavior, not subjective imagination.

Do not spend too much energy looking for reasons like "this might be the bottom." What you see is what you get; if you see a downward trend, go with the flow.

The market is still in a downward phase, and there are no signs of a bottom or reversal yet.

In summary, shorting at high points after a rebound remains the main idea at present.

Follow me for progress together. The article is published with a delay and is for reference only.

11.6 Market Analysis, Important Structure Analysis of Bitcoin, Preview_aicoin_Image7

免责声明:本文章仅代表作者个人观点,不代表本平台的立场和观点。本文章仅供信息分享,不构成对任何人的任何投资建议。用户与作者之间的任何争议,与本平台无关。如网页中刊载的文章或图片涉及侵权,请提供相关的权利证明和身份证明发送邮件到support@aicoin.com,本平台相关工作人员将会进行核查。

Share To
APP

X

Telegram

Facebook

Reddit

CopyLink