Bitcoin Price Watch: A Technical Tug-of-War in the Six-Figure Zone

CN
2 hours ago

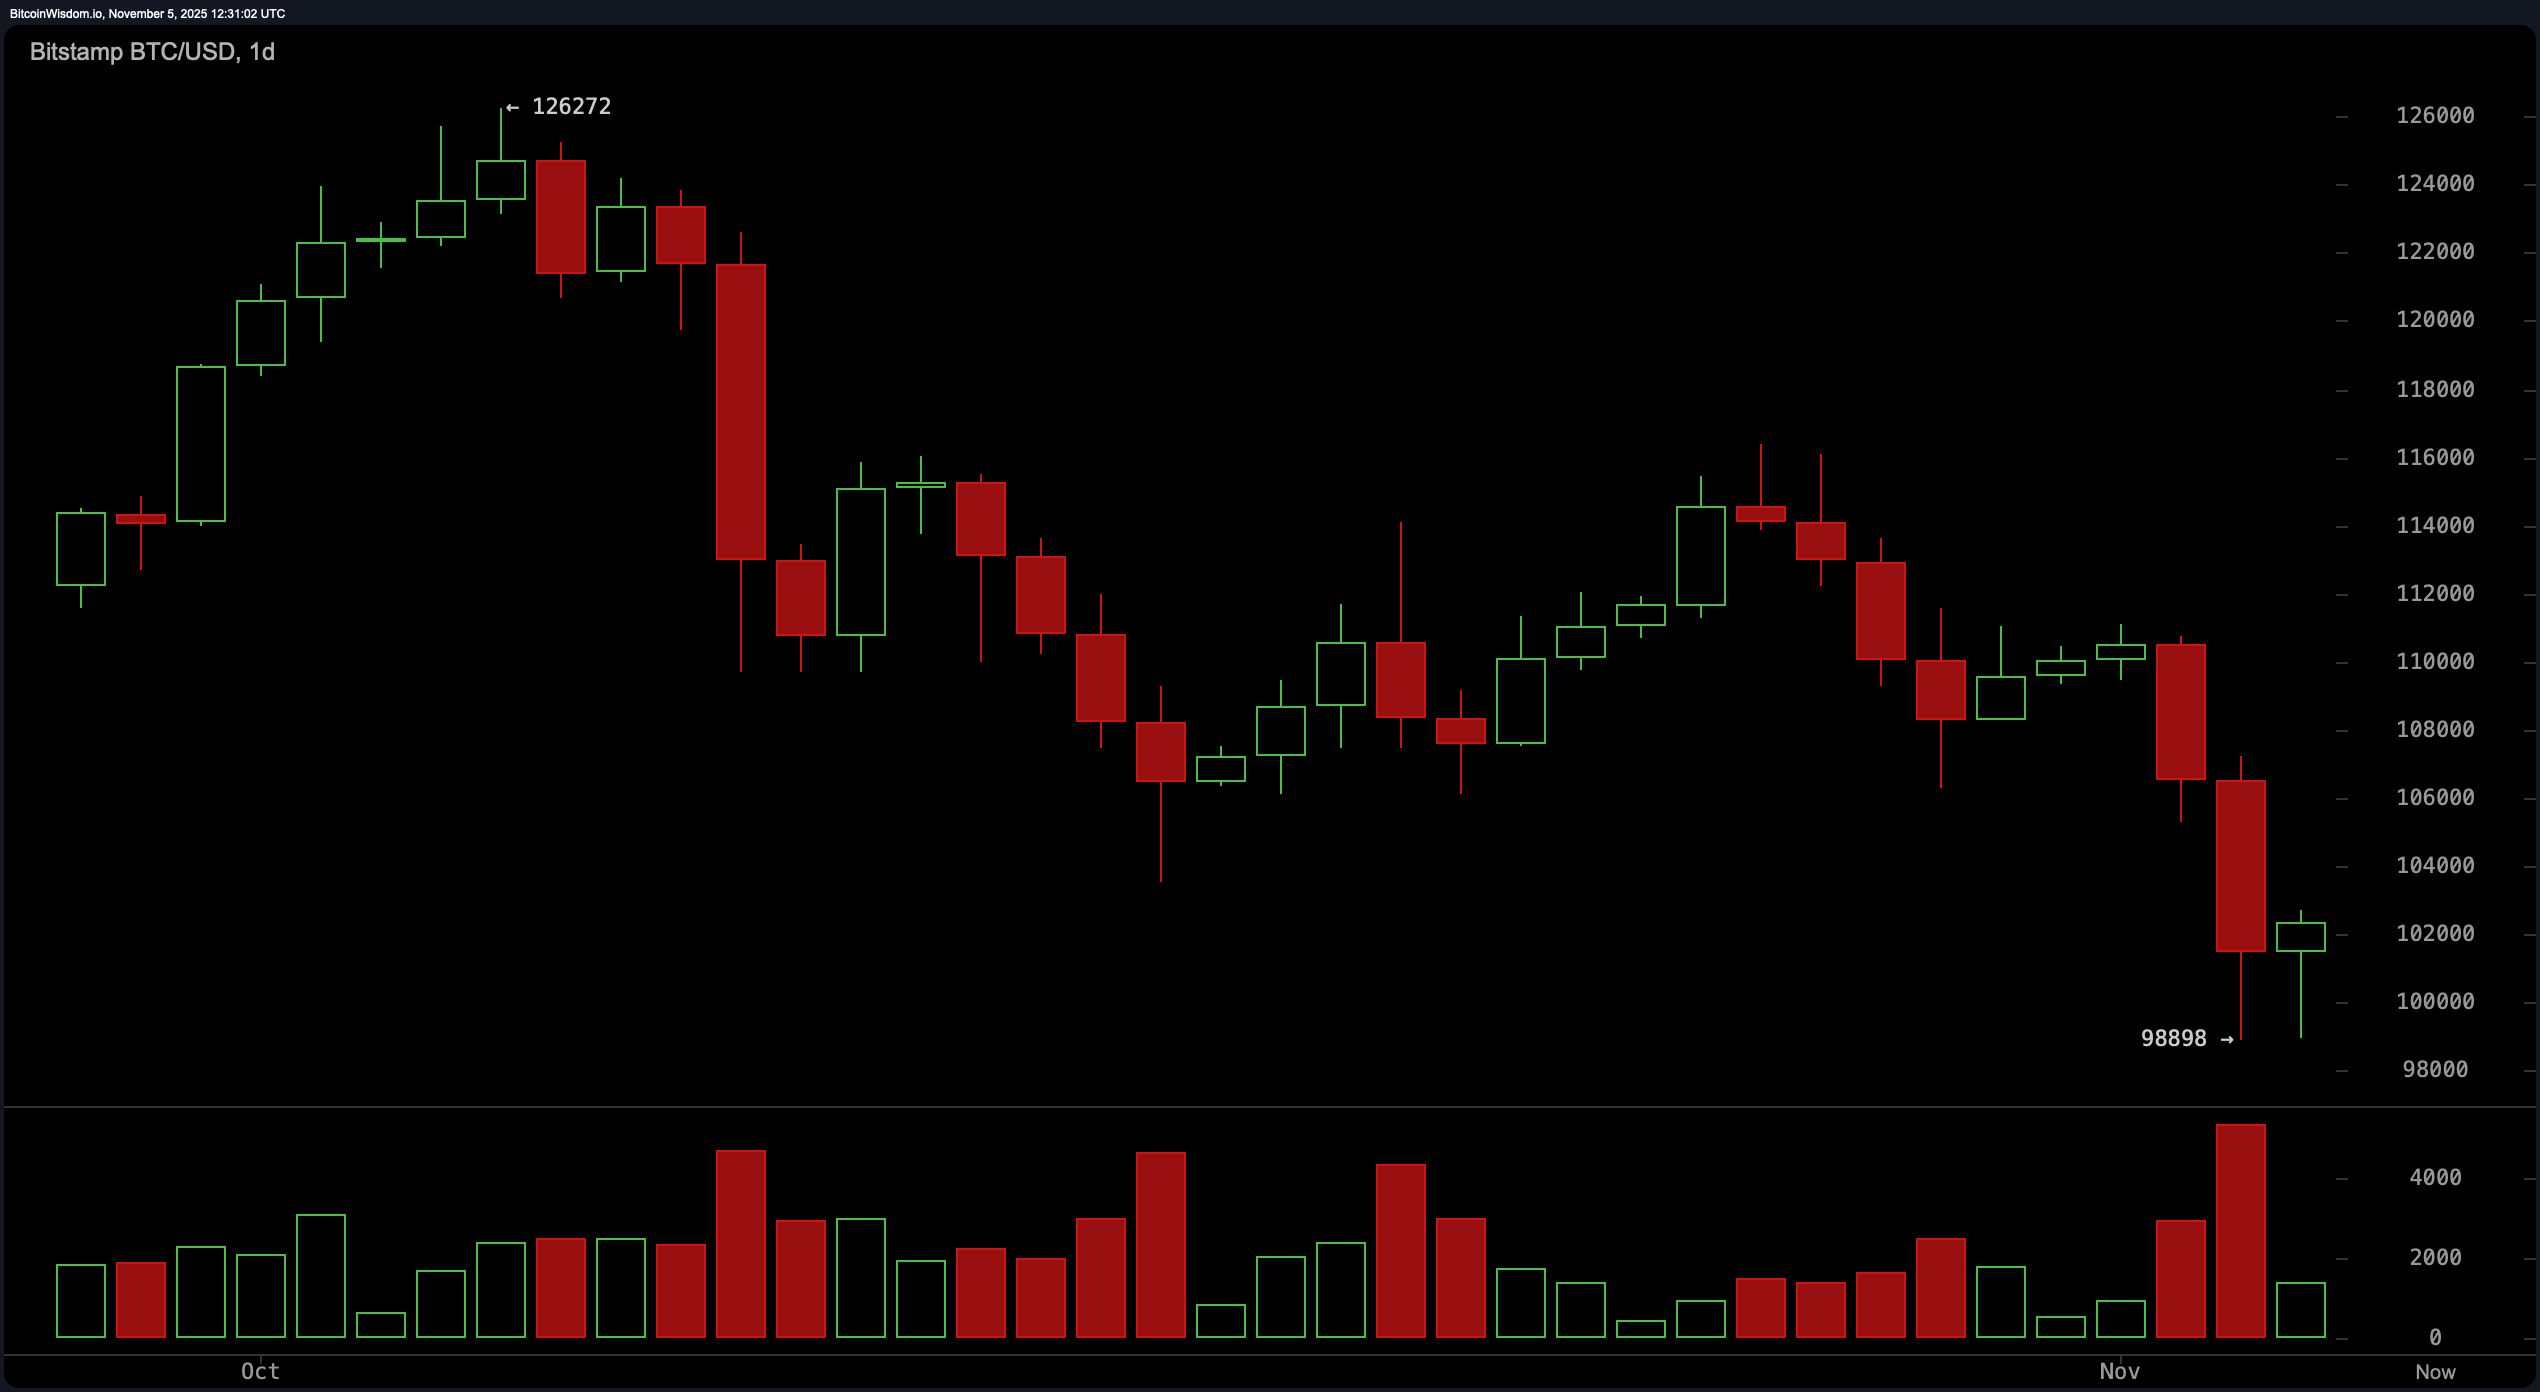
On the daily chart, bitcoin is dragging a red cape behind it like a battle-worn matador. The sharp fall from $126,000 to a local low of $98,898 was painted with heavy red candles and panic-selling volume — classic signs of capitulation. The presence of a doji near the bottom hints at potential stabilization, but don’t grab the confetti just yet.

The average directional index (ADX) clocks in at 20, indicating a weak trend, while the relative strength index (RSI) at 35 remains in neutral territory. With both the exponential moving average (EMA) and simple moving average (SMA) across all key intervals — from 10 to 200 — suggesting downside pressure, the trend is hanging on a fragile thread of hope.

Bitcoin Price Watch: A Technical Tug-of-War in the Six-Figure Zone

BTC/USD 1-day chart via Bitstamp on Nov. 5, 2025.

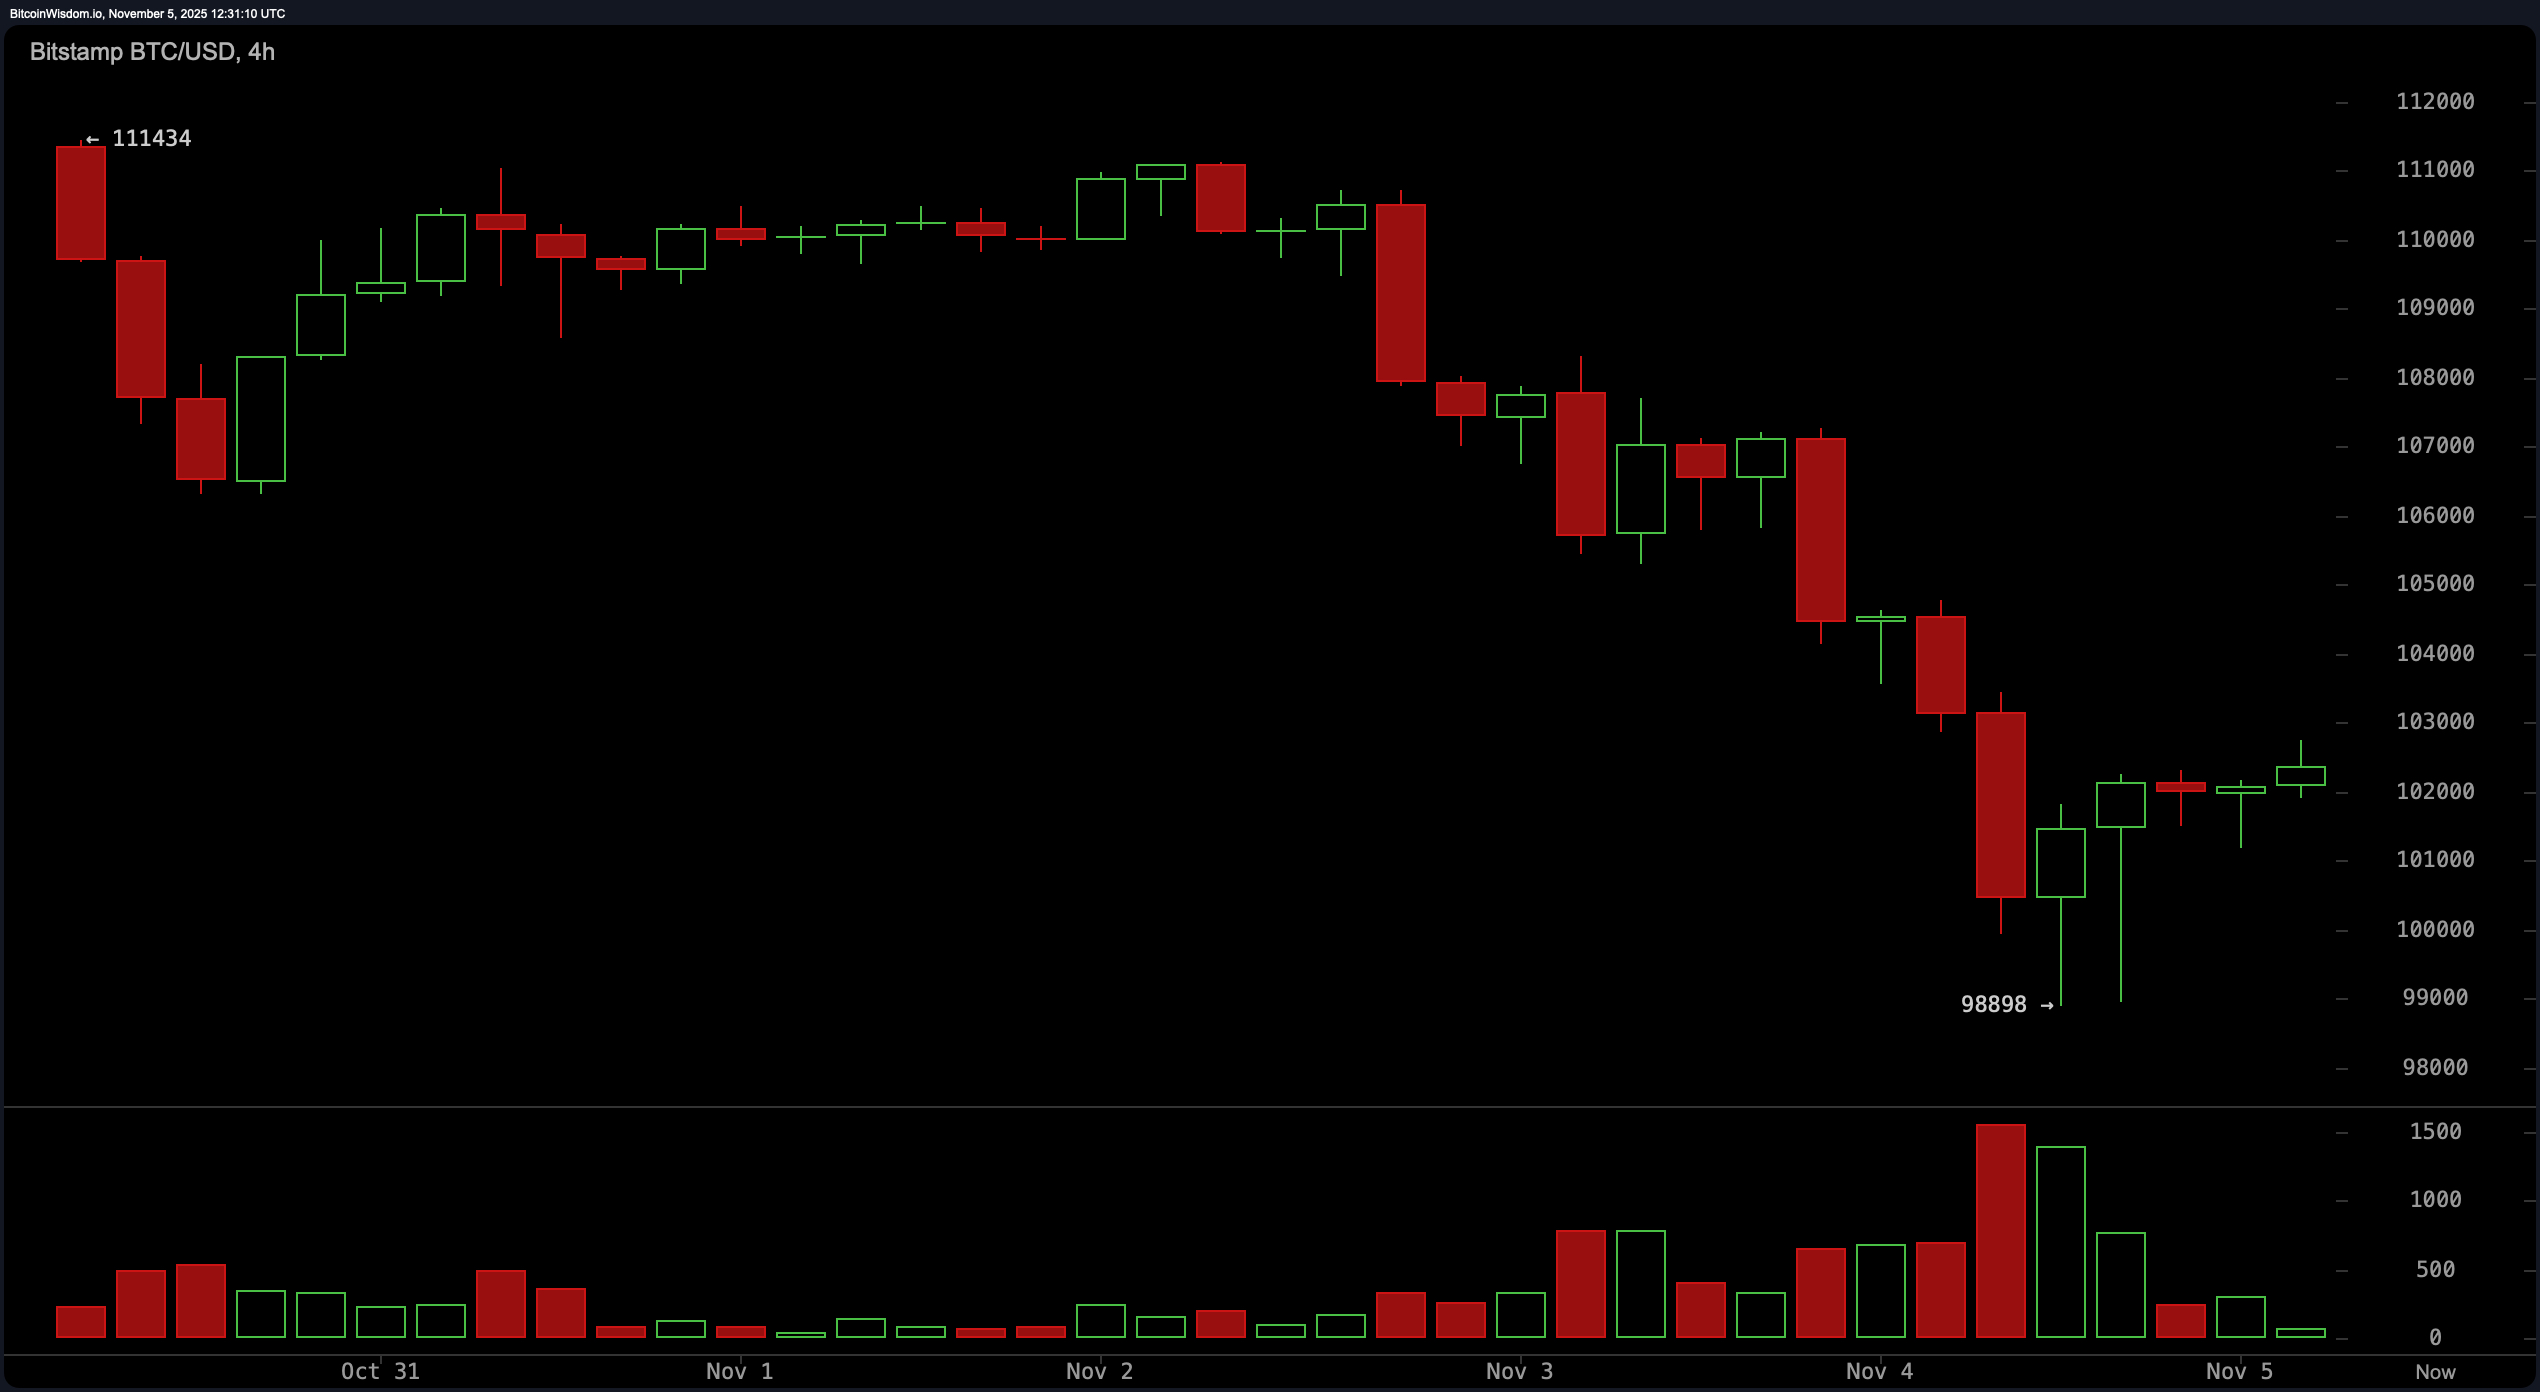
Zooming into the 4-hour chart, the bloodbath from $111,000 to $98,000 seems to be finding its emotional support group. The price has begun consolidating between $101,000 and $103,000, paired with a noticeable decline in bearish volume. This could suggest bears are catching their breath or simply stepping aside. The stochastic oscillator at 16 is also neutral, neither screaming oversold nor celebrating recovery. Traders eyeing short-term opportunity may keep a hawk’s eye on the $103,500 level — a decisive breakout above it could signal momentum’s comeback tour.

Bitcoin Price Watch: A Technical Tug-of-War in the Six-Figure Zone

BTC/USD 4-hour chart via Bitstamp on Nov. 5, 2025.

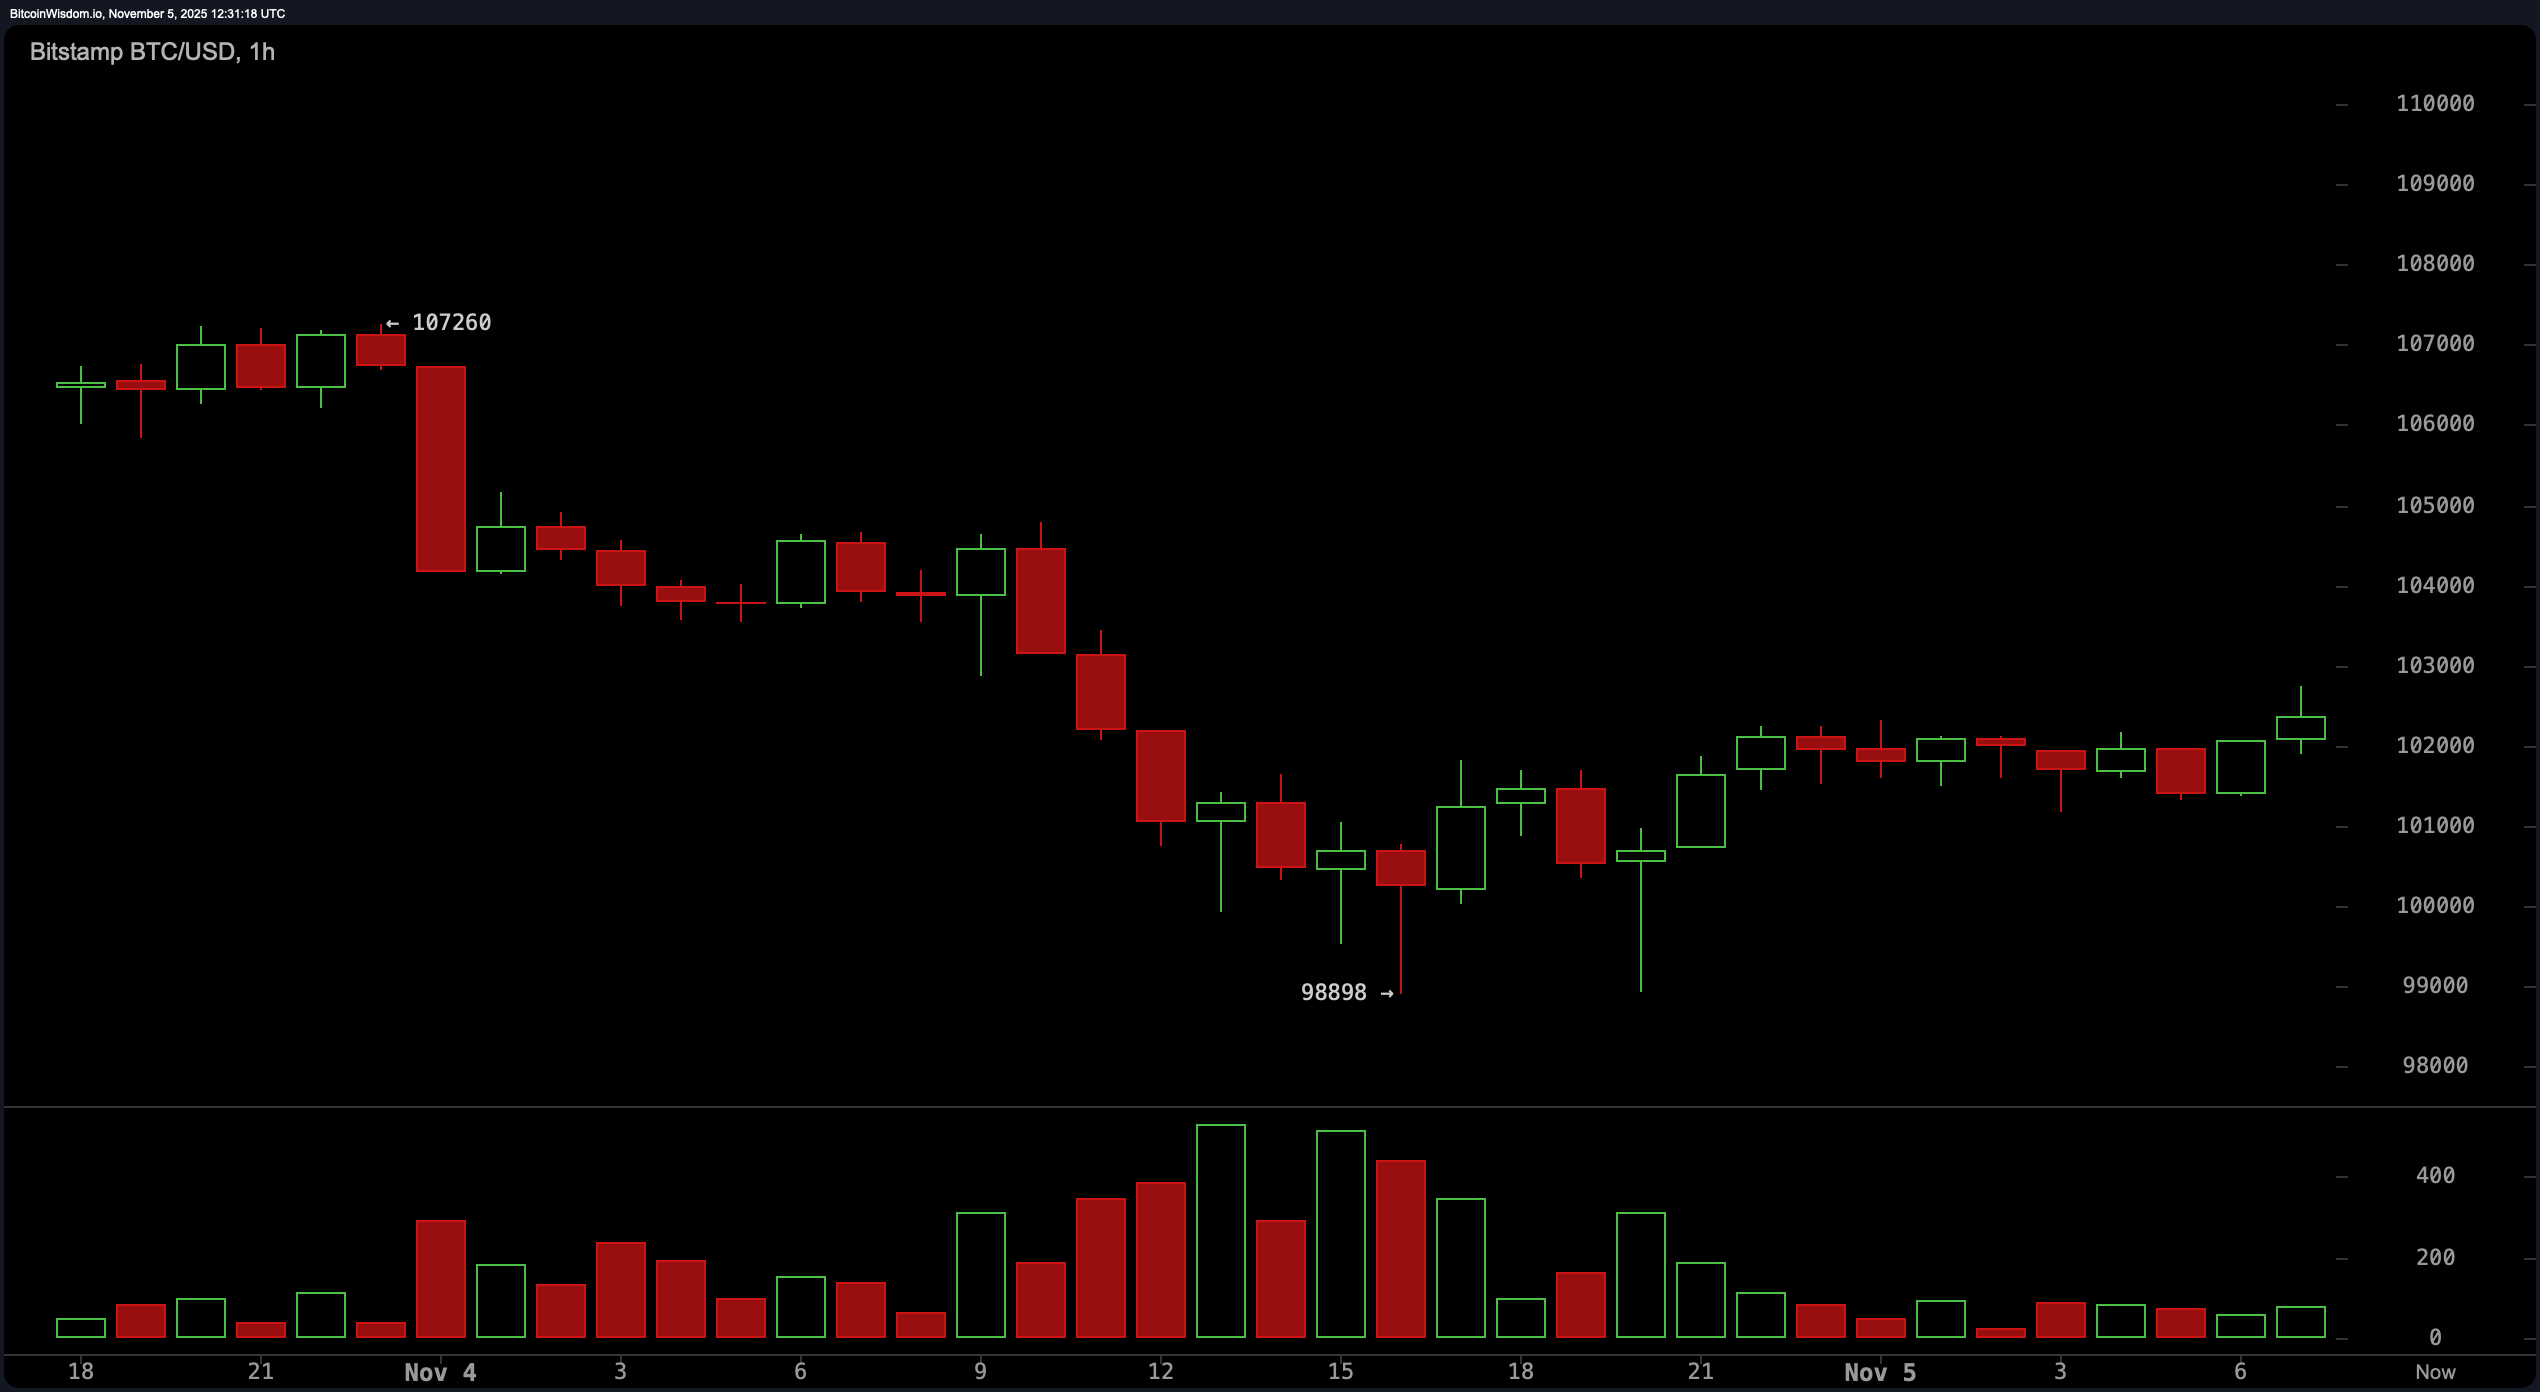
On the 1-hour chart, the mood is more quietly optimistic — as if bitcoin is slowly exhaling after a panic attack. The repeated defense of the $98,898 level, paired with a rounded bottom formation, points to accumulation behavior. Volume remains low, but steady climbs back to the $102,000 range offer glimmers of promise. The momentum indicator may be flashing red at -12,046, but the MACD (moving average convergence divergence) level at -2,225 implies the bearish momentum could be losing steam — albeit reluctantly. If bitcoin pushes past $103,000 with conviction, it may retest intraday targets of $105,000 to $107,000.

Bitcoin Price Watch: A Technical Tug-of-War in the Six-Figure Zone

BTC/USD 1-hour chart via Bitstamp on Nov. 5, 2025.

All oscillators are singing from different hymnals. While the commodity channel index (CCI) at -214 leans contrarian and optimistic, the awesome oscillator is neutral at -6,374, indicating indecision. The market is neither overbought nor comfortably oversold — it’s floating in a purgatory of potential. Momentum and MACD continue to weigh the coin down, but not without resistance from technical setups that suggest a possible reversal in sight.

Despite the doom-scrolling sentiment, bitcoin’s technical posture isn’t outright hopeless. The multi-timeframe analysis paints a nuanced picture: a market reeling from a punch, but still on its feet. Key levels to watch remain $98,000 as a make-or-break support, and $103,500 as the line between hesitation and short-term resurgence. One thing’s for sure — bitcoin may be down, but it’s far from boring.

Bull Verdict:

If bitcoin holds above the $99,000 support and reclaims $103,500 with volume confirmation, the setup across multiple timeframes hints at a potential relief rally. The rounded bottom on the 1-hour chart and waning selling pressure on the 4-hour timeframe could fuel a run toward $110,000, provided momentum indicators stabilize. Bulls might just have enough spark left to stage a short-term comeback — but they’ll need to move swiftly and decisively.

Bear Verdict:

The dominance of bearish momentum across the board, reinforced by every major exponential and simple moving average screaming downside from 10 to 200 periods, cannot be ignored. With the momentum and MACD indicators both entrenched in negative territory, any price uptick risks being a dead-cat bounce. Failure to defend $99,000 could open the gates to a deeper correction — and this time, the safety net might be far lower.

  • Where is bitcoin trading now?
    Bitcoin is currently trading around $102,423, near the midpoint of its daily range.
  • What’s the key support level to watch?
    The $99,000 level is acting as crucial support across multiple timeframes.
  • What price breakout could signal a short-term reversal?
    A strong move above $103,500 with volume may indicate bullish momentum.
  • Is bitcoin in a confirmed trend?
    No, technicals show consolidation with weak momentum and mixed indicators.

免责声明:本文章仅代表作者个人观点,不代表本平台的立场和观点。本文章仅供信息分享,不构成对任何人的任何投资建议。用户与作者之间的任何争议,与本平台无关。如网页中刊载的文章或图片涉及侵权,请提供相关的权利证明和身份证明发送邮件到support@aicoin.com,本平台相关工作人员将会进行核查。

Share To
APP

X

Telegram

Facebook

Reddit

CopyLink