11.5 market analysis, trend downwards, shorting wins big.

CN
89751306
Follow
5 hours ago

Beijing Time, November 5th, Wednesday morning.

Currently, the price of Bitcoin has officially fallen below 100,000, with a low point reaching 90,000. Over the past period, I have been continuously sharing short-selling strategies at high positions. Friends who followed these suggestions should have made good profits.

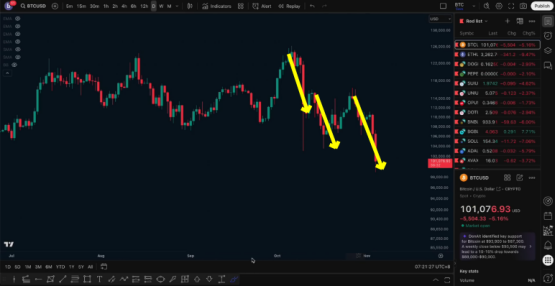
Looking back at this entire downtrend, it can be divided into three segments.

11.5 Market Analysis, Downward Trend, Short Selling Success_aicoin_Image 1

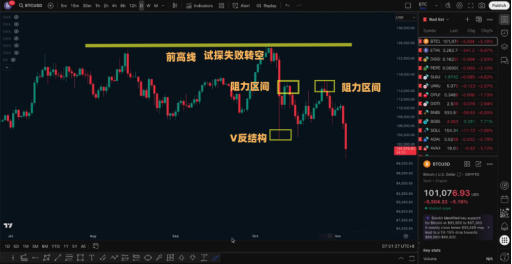
The first segment of the decline formed around 122,000. At that time, the previous high point failed to break through, and I also suggested that short positions could be established at that level. Starting from 122,000, the short target was between 110,000 and 100,500, and the final low indeed fell below 100,500, reaching 100,300.

After that, the market experienced a rebound.

11.5 Market Analysis, Downward Trend, Short Selling Success_aicoin_Image 2

The 0.5—0.618 retracement zone during this pullback is a pressure zone, and it is worth considering establishing short positions again, with the target still looking at the previous low. Then, ten days ago, the pressure zone to watch was still the upper 0.5—0.618 retracement zone.

When the price reached that zone again, we reminded that this is still a resistance area, and one can short at highs, with the stop-loss set at 117,500 (the 0.618 position), targeting a break below the previous low between 103,000 and 100,000, with even a chance to drop below the 100,000 integer mark.

As a result, the market did indeed fall below 100,000, with a low reaching 98,000—98,500. All three predictions were validated by the market trend.

At the same time, why do I keep emphasizing 100,000?
Because 100,000 is an integer level and the last defense point for bulls. Once it is broken, it will trigger liquidations, bringing more liquidity, which is a key driving force behind the market's decline.

Back to the current market:

Now the price has effectively fallen below the 100,000 integer level. After this level is breached, I do not recommend continuing to chase shorts in the short term.
If you have long-term short positions above, you can continue to hold them without issue. However, if you are concerned about profit retracement, you can take partial profits or move your stop-loss down to lock in some profits. This way, even if the market rebounds, it will not affect your main profits.

However, short positions are not recommended to chase at this time.

This wave of decline has basically completed, and there is an expectation of a short-term rebound.

Can we go long?

I do not recommend that either.

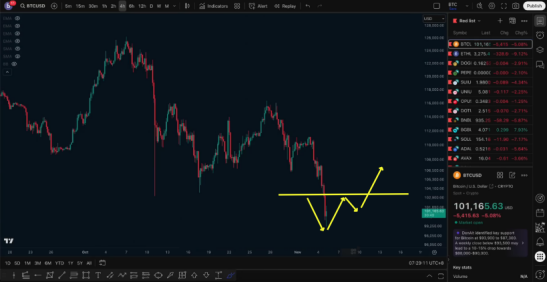
The current structure is still bearish, and no new bullish segment has formed. Only when there is a clear "bottoming + V-shaped reversal + bullish arrangement" structure can we consider short-term longs; the current conditions are not yet mature.

11.5 Market Analysis, Downward Trend, Short Selling Success_aicoin_Image 3

Let’s focus on the weekly level trend.

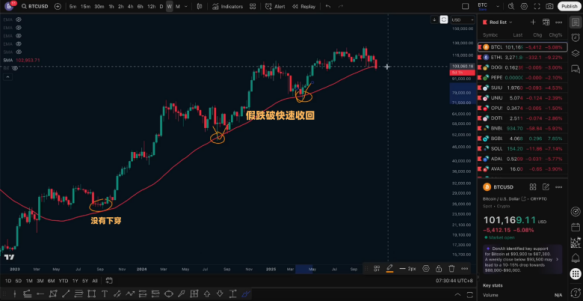
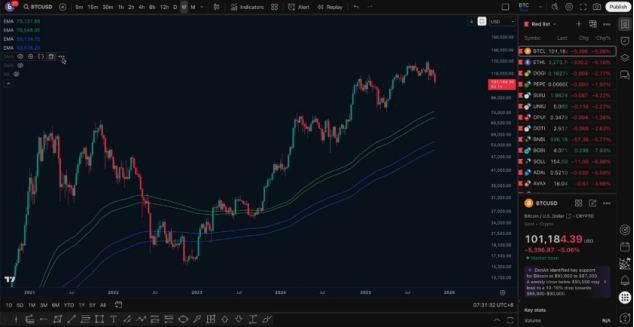
In the past, we have been paying attention to the 50-week moving average, which is currently around 100,270. The price has now formed a breach; if this week closes still below the moving average, it means the structure will shift from "bullish" to "bearish."

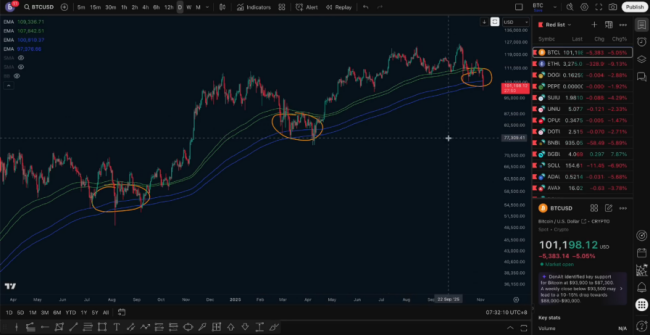
The chart shows three touches of the weekly line:

The first did not break down, while the second and third were false breaks, quickly recovering without forming a substantial bearish trend.

11.5 Market Analysis, Downward Trend, Short Selling Success_aicoin_Image 4

This time, if the 50-week moving average (100,270) cannot be held, it may officially enter a weekly correction cycle.

Since breaking above the 56-week moving average at 24,000, the market has been on an upward trend.

If this breach is confirmed, it means the upward cycle has ended, and the price may enter a period of mid-term correction.

Where is the potential support for the downtrend cycle?
The weekly VGS channel range is between 50,000 and 70,000.

11.5 Market Analysis, Downward Trend, Short Selling Success_aicoin_Image 5

The potential buying zone for the larger cycle remains at 50,000—70,000.

Looking at the daily structure: the price has now retraced to the second layer of the daily VGS channel. This position is similar to the past few support areas of the channel.

11.5 Market Analysis, Downward Trend, Short Selling Success_aicoin_Image 6

If the weekly line can stabilize above the 50-week moving average again, and the daily line forms a bullish structure, then this position could become a new daily buying zone.

Conversely, if the 50-week moving average continues to break down, it indicates that support has failed, and the market will likely retrace deeper into the weekly channel, specifically in the range of 70,000—50,000.

However, this does not mean entering a bear market; it is just a significant level of channel retracement.

Finally, to add, regarding altcoins, my view remains unchanged—
The current market structure is different from the past bull markets; there is no "comprehensive altcoin bull."
The so-called altcoin trend will only manifest in specific, rotational coins, such as the previous MEME, SOL, and Ethereum in the short term.

Most other altcoins are either stagnant or continue to decline. Most altcoins will not "go to zero," but they will get close to zero.

Follow me, and let’s improve together. The article is published with a delay and is for reference only.

免责声明:本文章仅代表作者个人观点,不代表本平台的立场和观点。本文章仅供信息分享,不构成对任何人的任何投资建议。用户与作者之间的任何争议,与本平台无关。如网页中刊载的文章或图片涉及侵权,请提供相关的权利证明和身份证明发送邮件到support@aicoin.com,本平台相关工作人员将会进行核查。

Share To
APP

X

Telegram

Facebook

Reddit

CopyLink