
大饼周线收线双阴夹阳,再加上今天开盘就下跌,短线仍然是下跌的趋势,日线三角结构目前正在考验下方的支撑,且有跌破的概率。所以这里我们要关注是否会再次回踩插针低点后反弹,或者跌破后收回——这两种情况都有利于多头;否则从技术指标和裸K指标来看,总体仍然是偏空的。
以太的周线走势更加明显,前六周K线走出了两组双阴夹阳,本周一开盘就往下跌,日线还形成了下降通道。自周线MACD下穿零轴开始,“公子”就提醒了这一点。目前日线再次测试3660附近的支撑,同样存在测试10月10号暴跌插针低点,甚至跌破的概率。
大饼
大饼从10月10号暴跌插针以来,23个交易日内收出12根阳线、11根阴线。反弹未突破116,000,上升空间就无法打开,目前仍在测试收敛三角下沿。这种情况下,存在跌破后再次试探前期插针低点,甚至进一步跌破的概率;多头若想延续趋势,即便在最差的情况下,也需要先跌破再收回。
日线(按新加坡时间收盘价计算)方面,OBV指标近期连续下跌,但始终未跌破9月初和10月10号的低点,这一点值得关注。很多人会类比前一轮牛市结束、打出次高后的回调走势,当前10万就是关键的牛熊分界线——此处若跌破,将增加熊市的概率,因此这些位置至关重要。
●支撑:101516—103400

●压力:111200—116000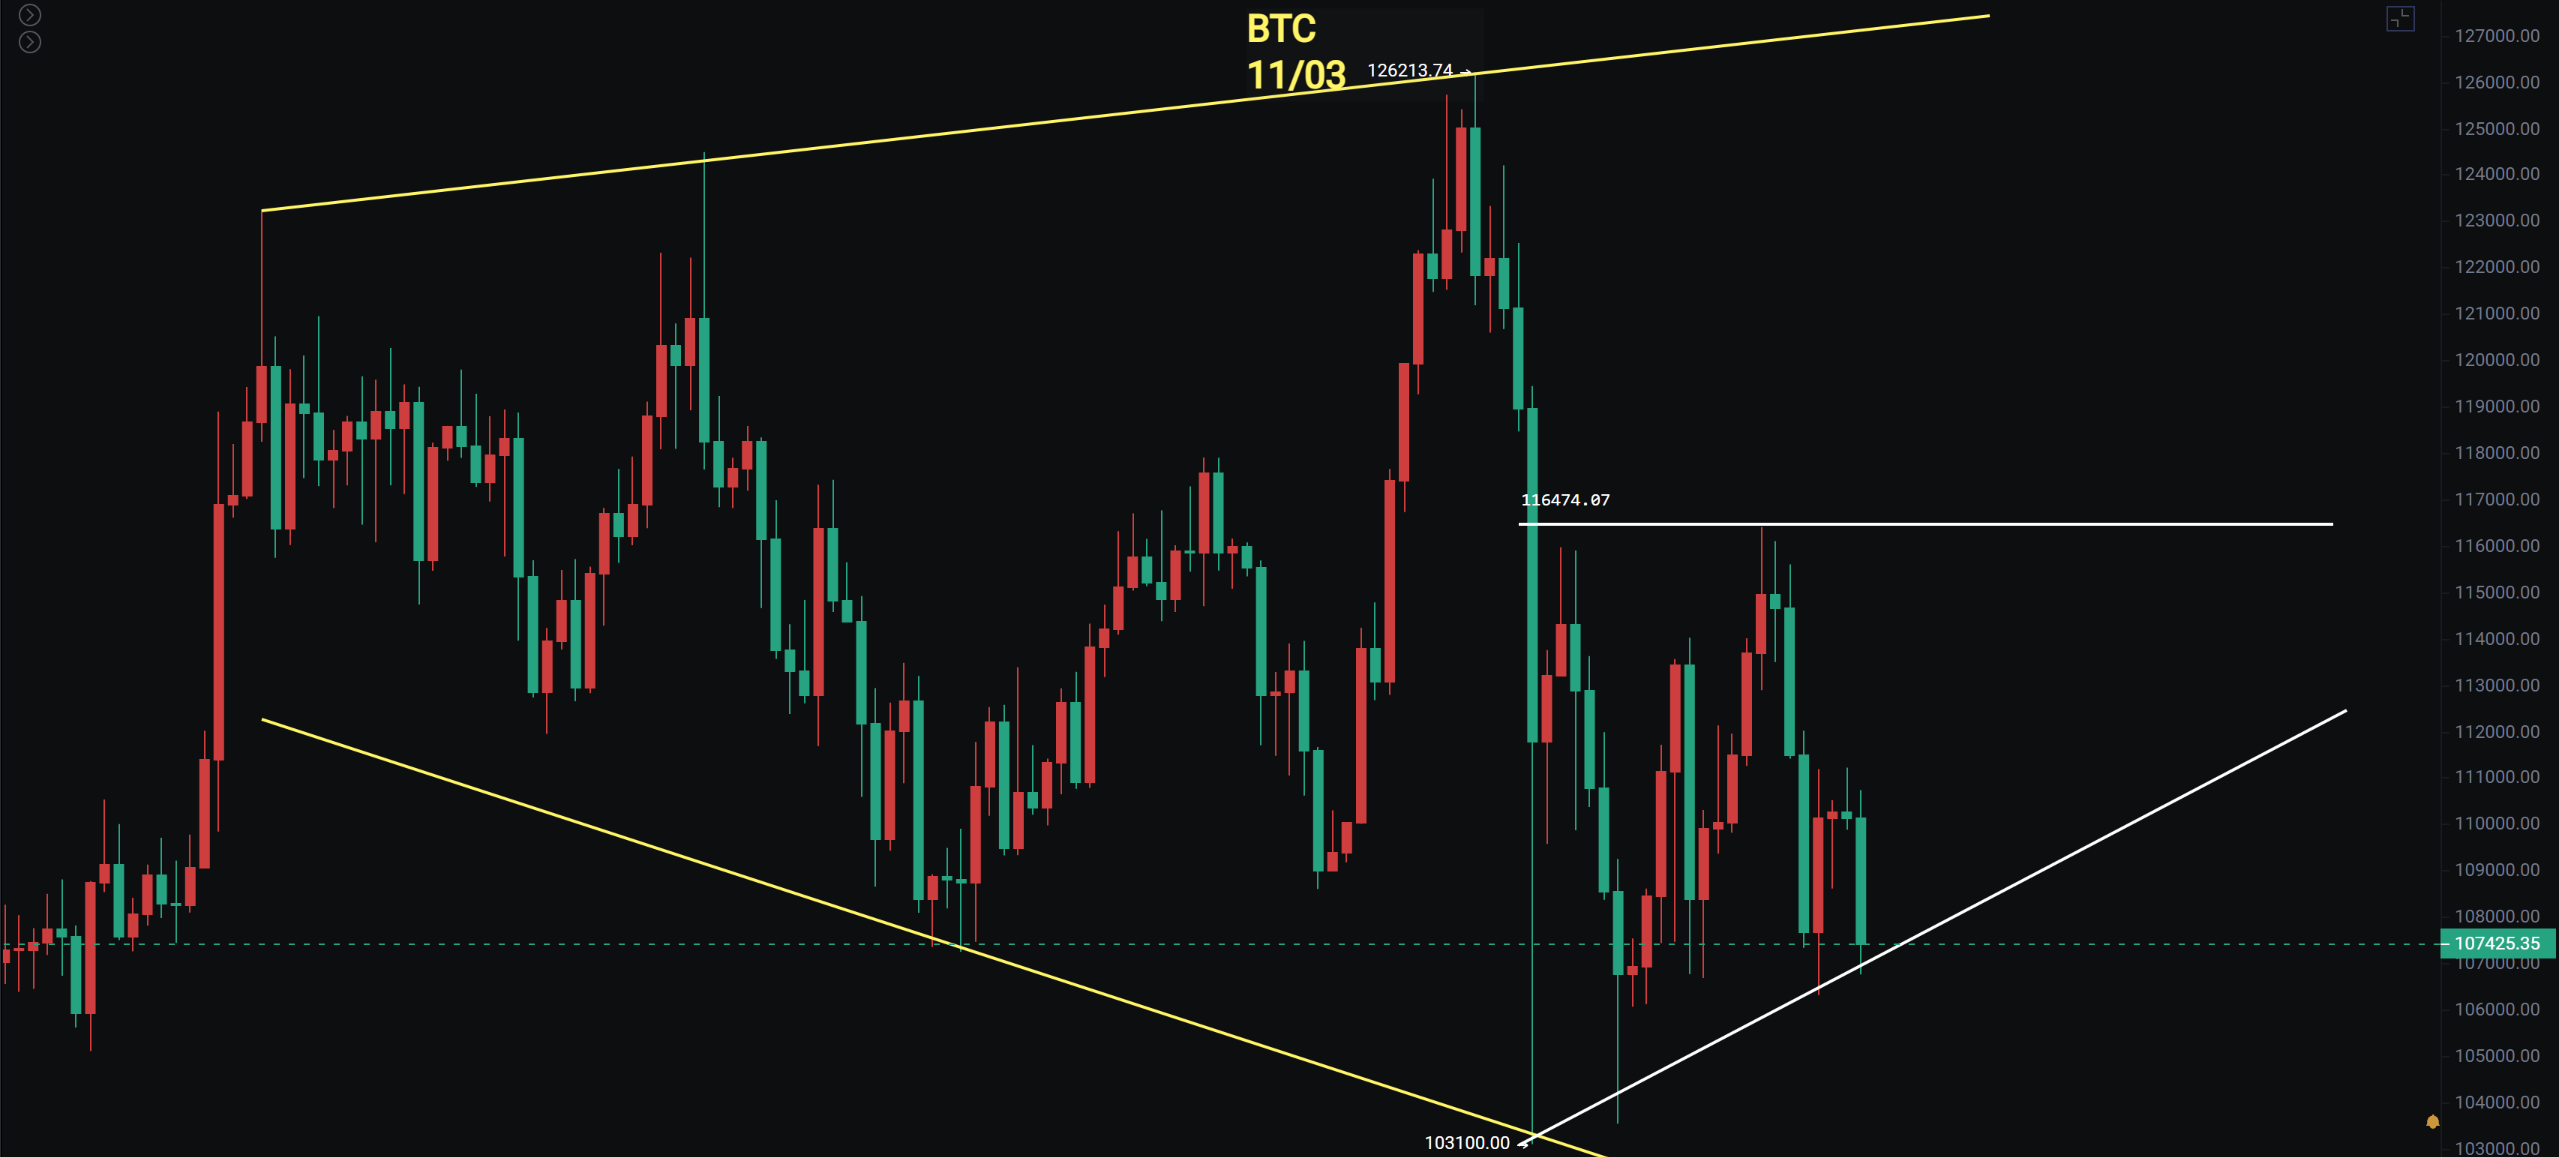
以太
日线延续下降通道,且高点持续降低,价格也未收回到箱体内部,整体走势偏弱。不过尽管以太表现不佳,“公子”仍然不太担心它,反而更关注大饼的支撑情况。ETH/BTC汇率一直受下降趋势线压制,后续虽肯定有突破机会,但需要时间;从下跌节奏来看,当前仍处于下跌A浪,需关注后续的反弹B浪。
4小时图形成下降三角形态,3660附近已测试五次,短线此处存在支撑。但“不破不立”,目前仍不是理想的抄底机会,建议耐心等待。
●支撑:3435—3660

●压力:3920—4300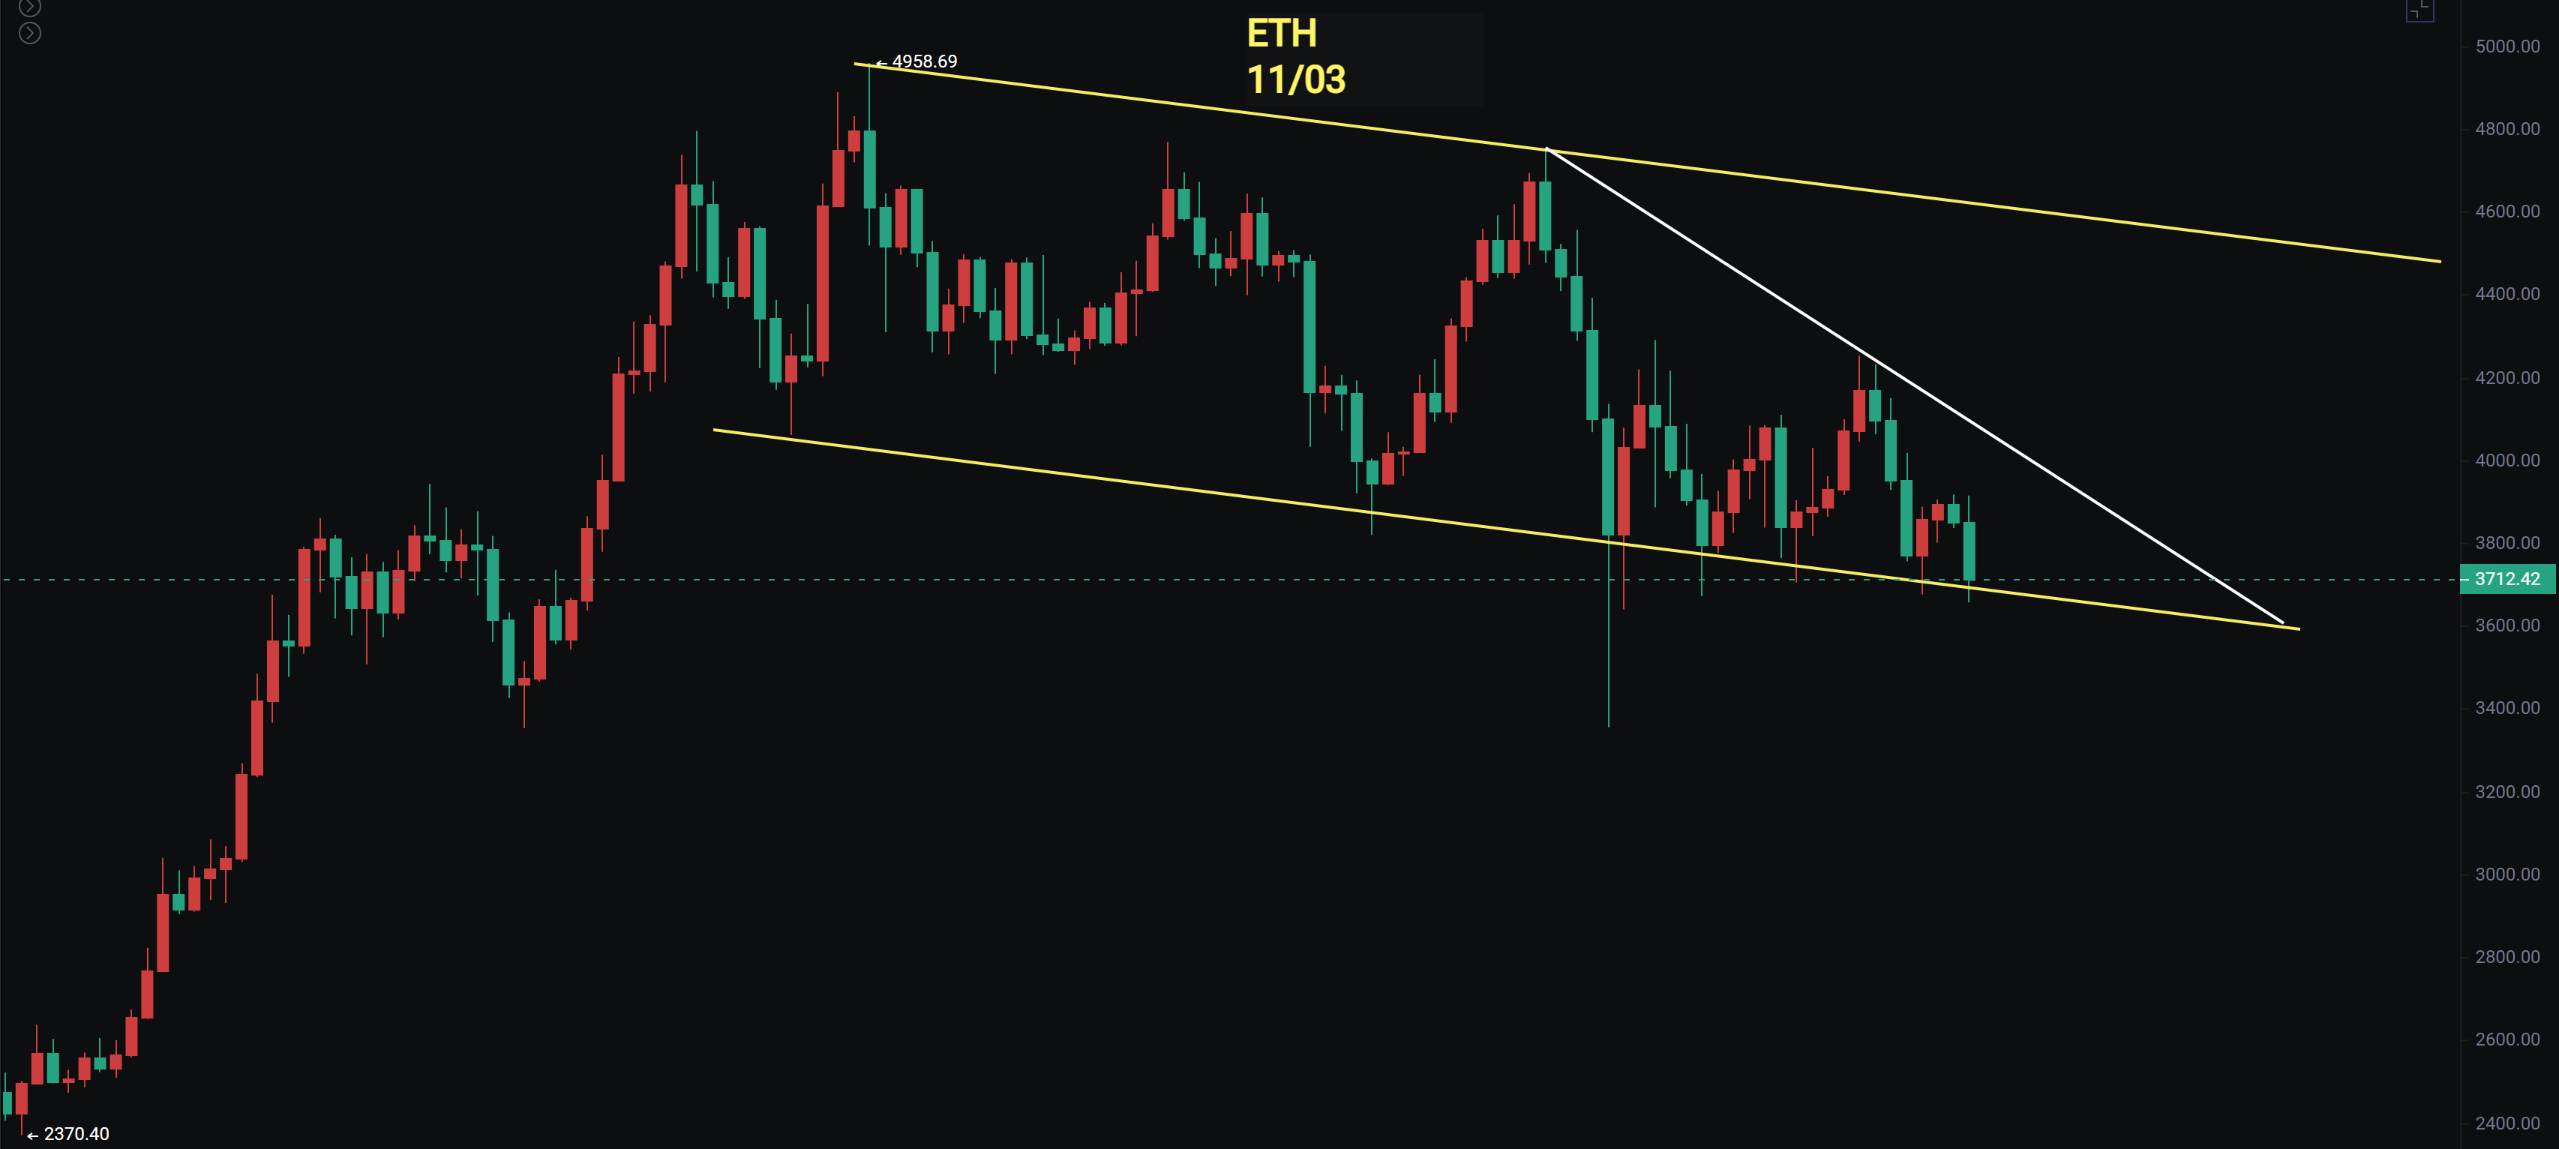
你喜欢我的观点,请点赞评论分享,我们一起穿越牛熊!!!
文章具有时效性,仅供参考实时更新
专注k线技术研究,共赢全球投资机会公众号:BTC交易公子扶苏

免责声明:本文章仅代表作者个人观点,不代表本平台的立场和观点。本文章仅供信息分享,不构成对任何人的任何投资建议。用户与作者之间的任何争议,与本平台无关。如网页中刊载的文章或图片涉及侵权,请提供相关的权利证明和身份证明发送邮件到support@aicoin.com,本平台相关工作人员将会进行核查。


