作者:Michael Nadeau
编译:白话区块链
后疫情时代一直由财政主导所定义——一种由政府赤字和短期国债发行驱动的经济,即使美联储维持高利率,流动性仍保持在高位。
今天,我们正在进入私人部门主导的阶段,与上届政府相比,财政部正通过关税和支出限制来收回流动性。
这就是为什么利率需要下降。
我们通过全球流动性的视角来剖析当前周期,以强调为什么当前这一轮“贬值交易”已走到最后阶段。
财政主导正在结束吗?
我们总是希望在所有人都“追涨”时“抄底”。
这就是为什么最近所有关于“贬值交易”的讨论引起了我们的注意。
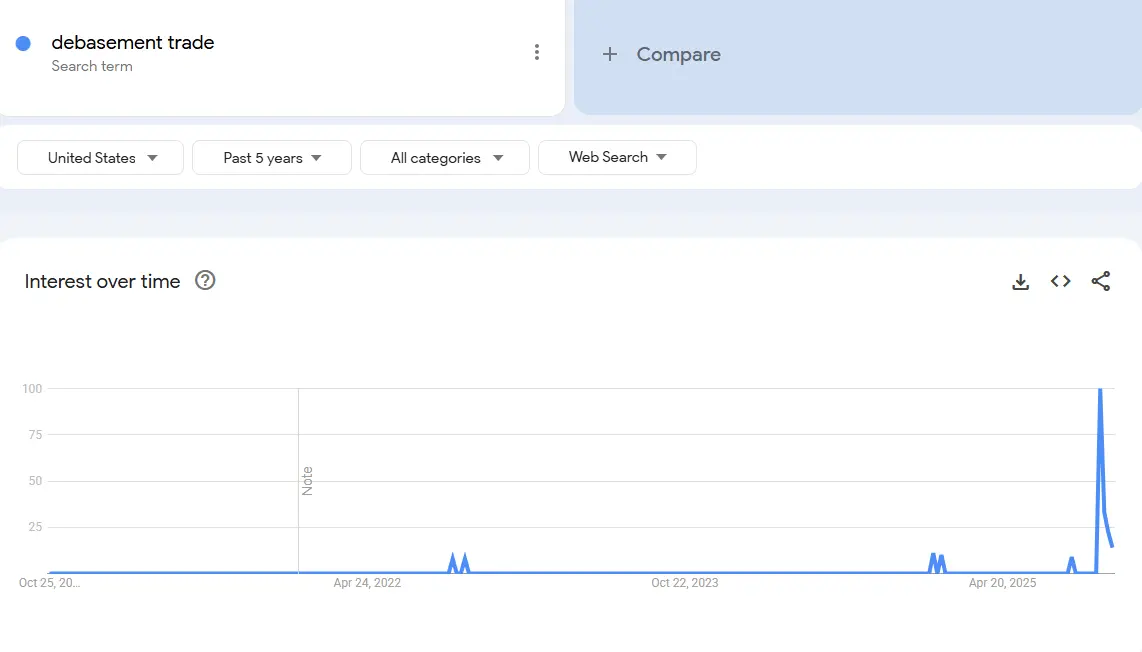
数据:Google Trends(谷歌趋势)
我们认为,对“贬值交易”感兴趣的时机是几年前。那时比特币价格为2.5万美元,黄金价格为2千美元。那时除了加密货币和宏观分析师之外,没有人谈论它。
在我们看来,这项“交易”已基本完成。
因此,我们的工作是了解创造它的条件,以及这些条件是否会继续存在。
是什么驱动了这项交易?在我们看来,主要是两个因素。
1. 财政部支出。在拜登政府时期,我们实施了大规模的财政赤字。
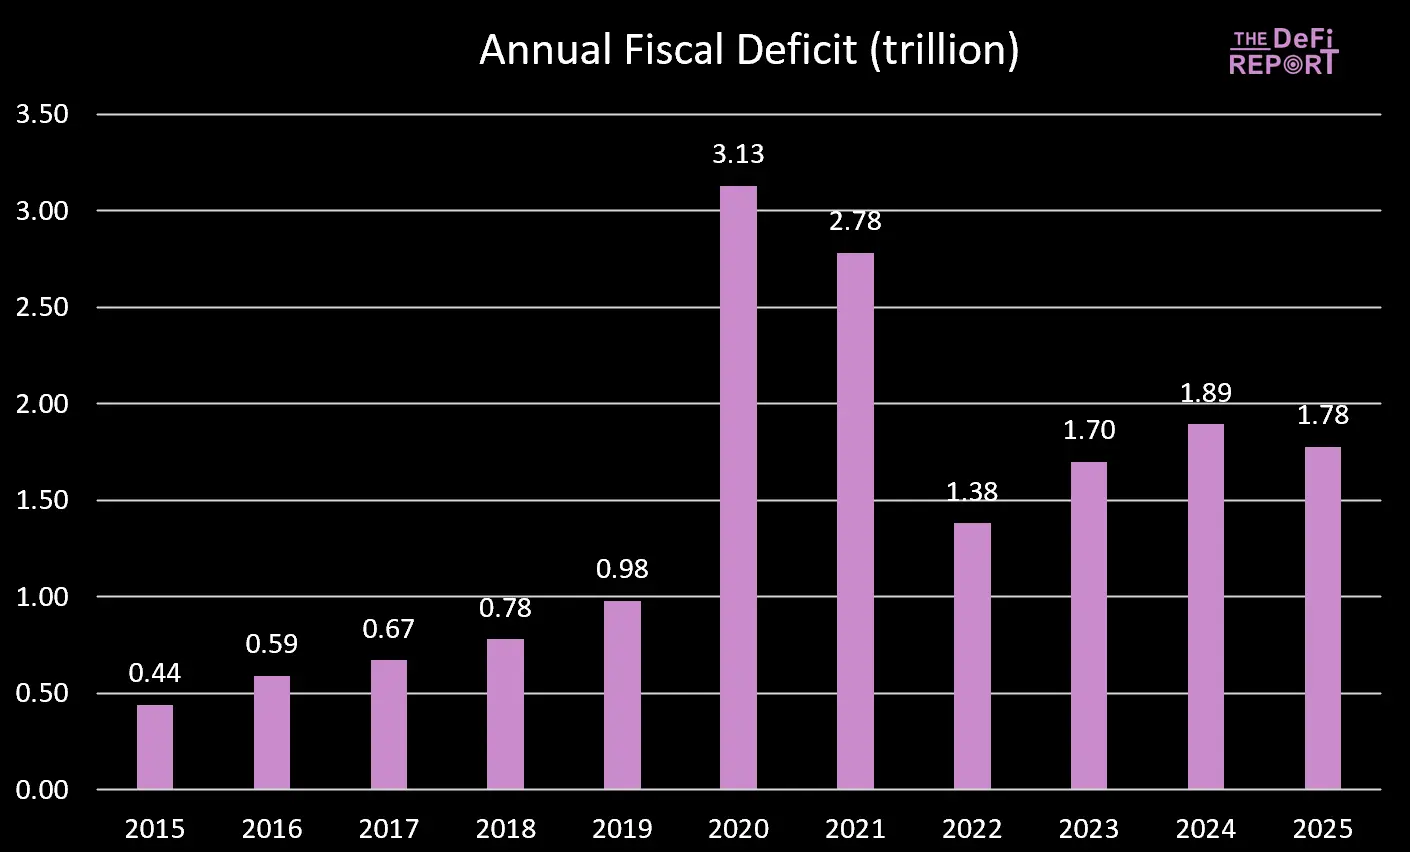
数据:US Treasury(美国财政部)
2025财年刚刚结束,赤字略有下降——这主要是由于税收增加(关税)而不是支出减少。然而,预计《大美法案》(Big Beautiful Bill)将通过削减医疗补助(Medicaid)和补充营养援助计划(SNAP)的福利来实现支出削减。
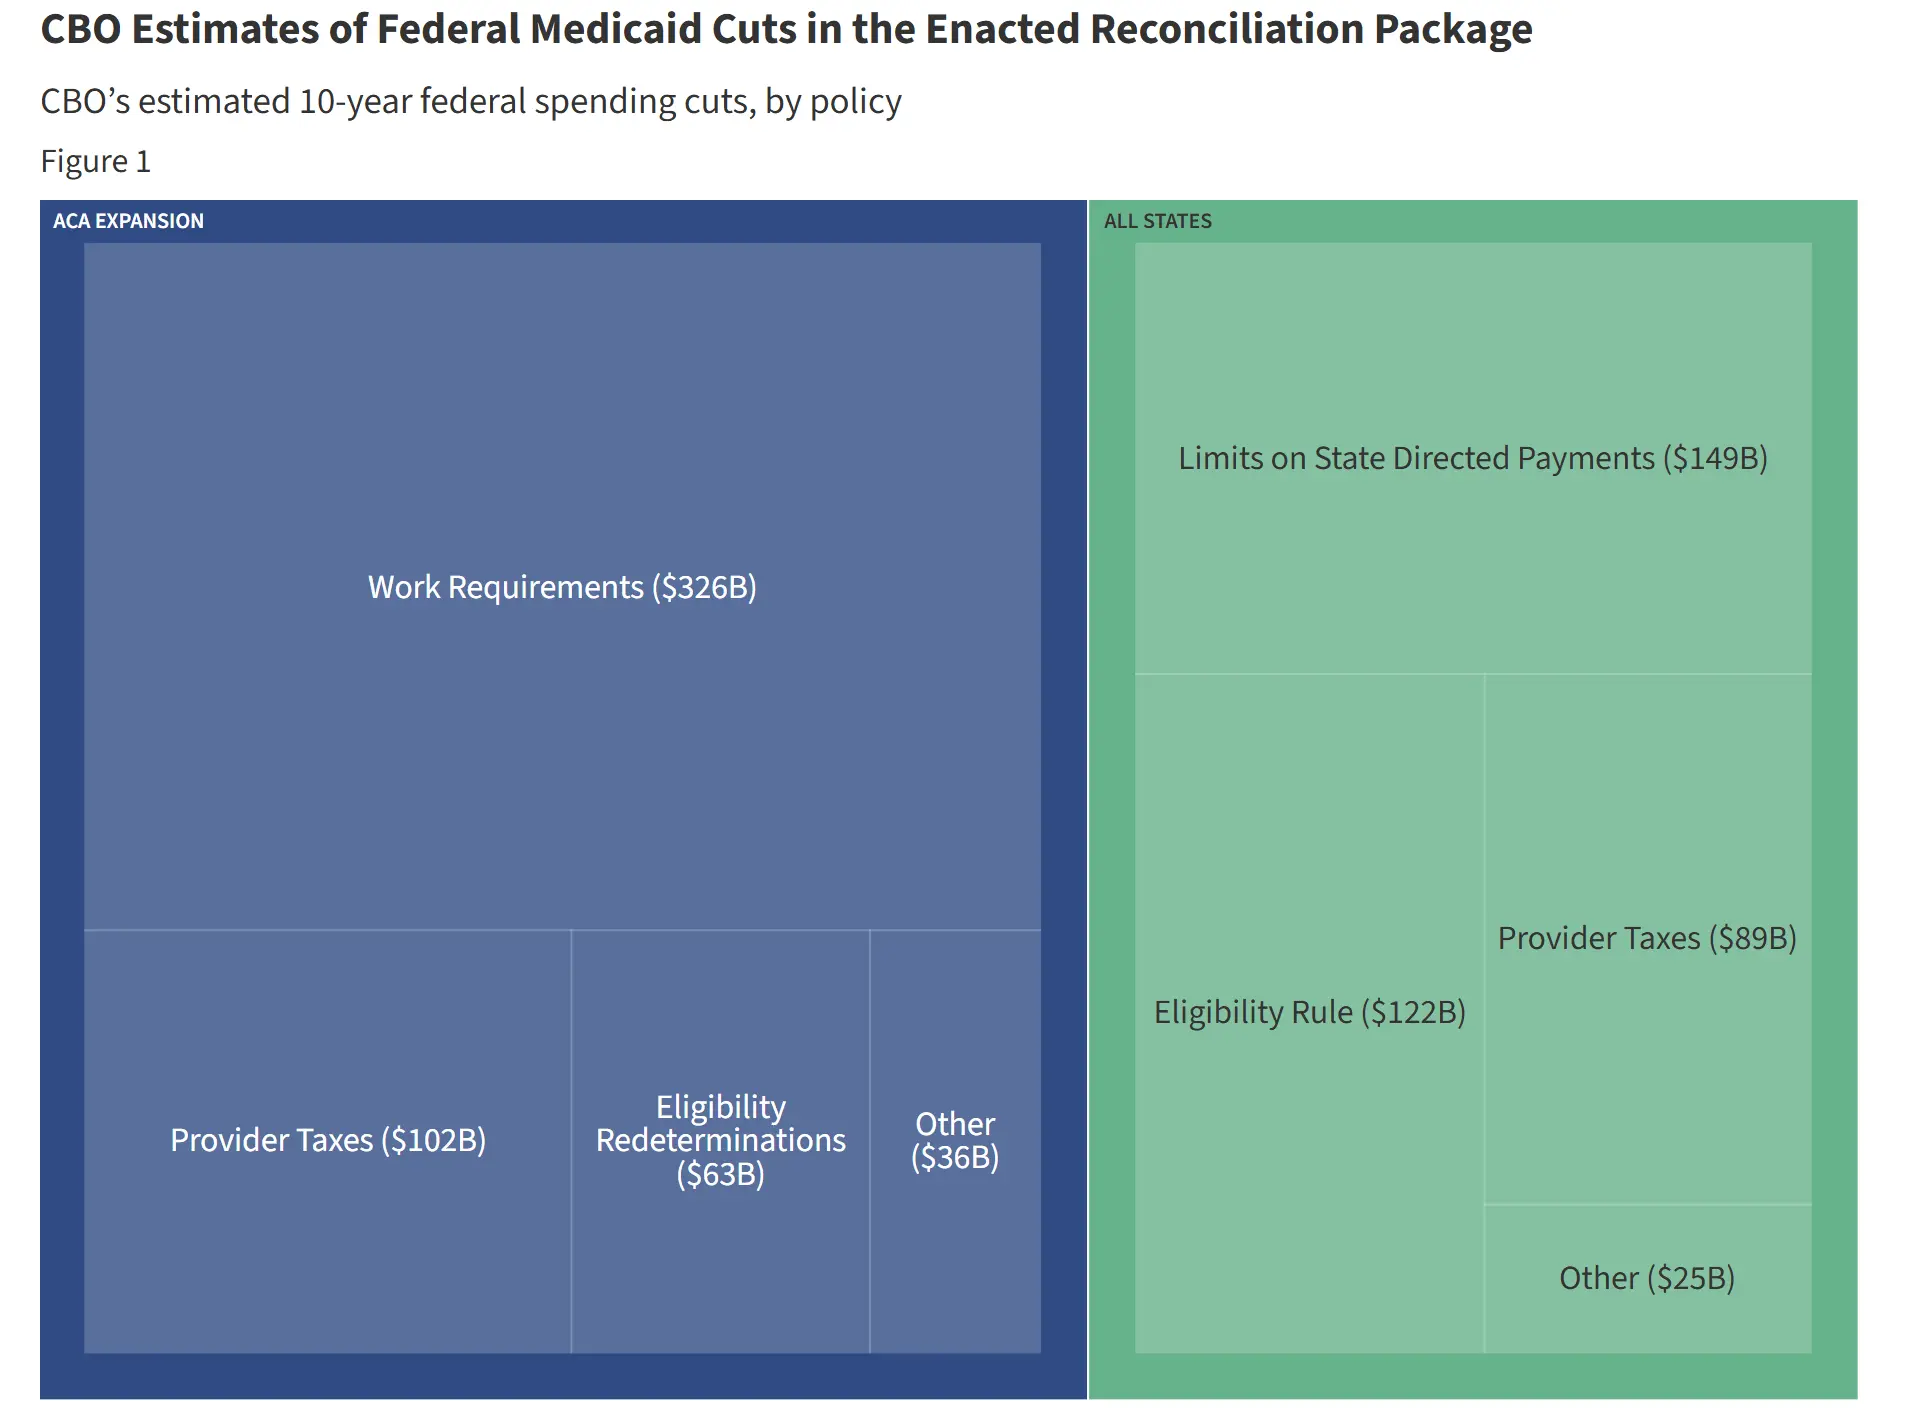
数据:KFF(凯泽家庭基金会)削减与当前支出轨迹的对比
在拜登执政期间,政府支出和转移支付为经济持续注入流动性。但在《大美法案》下,支出增长放缓。
这意味着政府推入经济的资金减少了。
此外,政府正通过关税从经济中抽出资金。
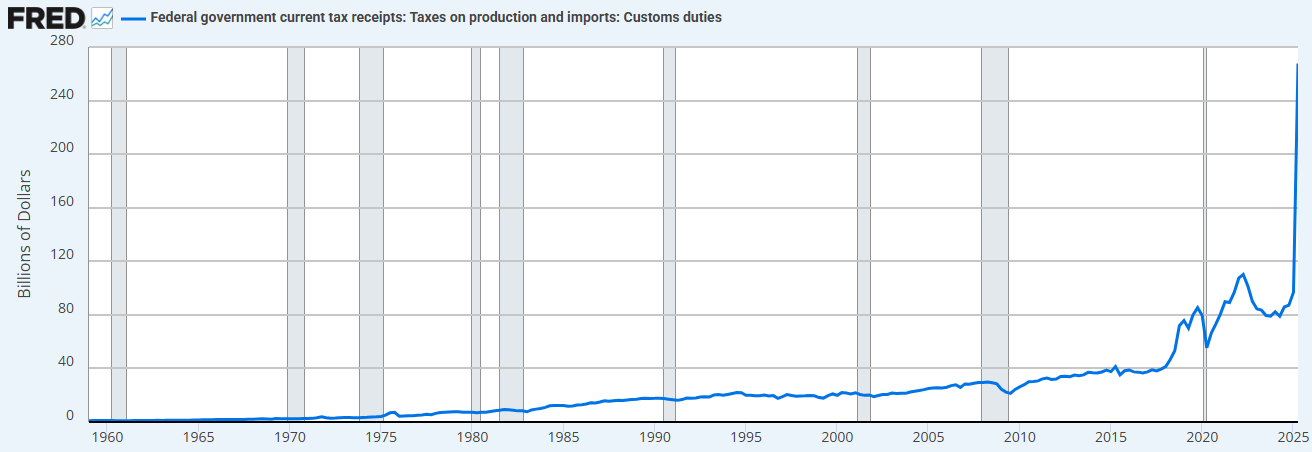
数据:FRED(圣路易斯联储经济数据)
支出限制(相对于前一届政府)和关税增加的结合意味着财政部现在正在吸收流动性,而不是供应流动性。
这就是我们需要降息的原因。
“我们将重新私有化经济,重振私营部门,并缩小政府部门。” -斯科特·贝森特 (Scott Bessent)
2. “财政部量化宽松”(Treasury QE)。为了资助拜登政府时期财政部的过度支出,我们也看到了一种新形式的“量化宽松”(QE)。我们可以在下方(黑线)观察到这一点。“财政部量化宽松”通过短期票据而非长期债券为政府支出提供资金,从而支撑了市场。
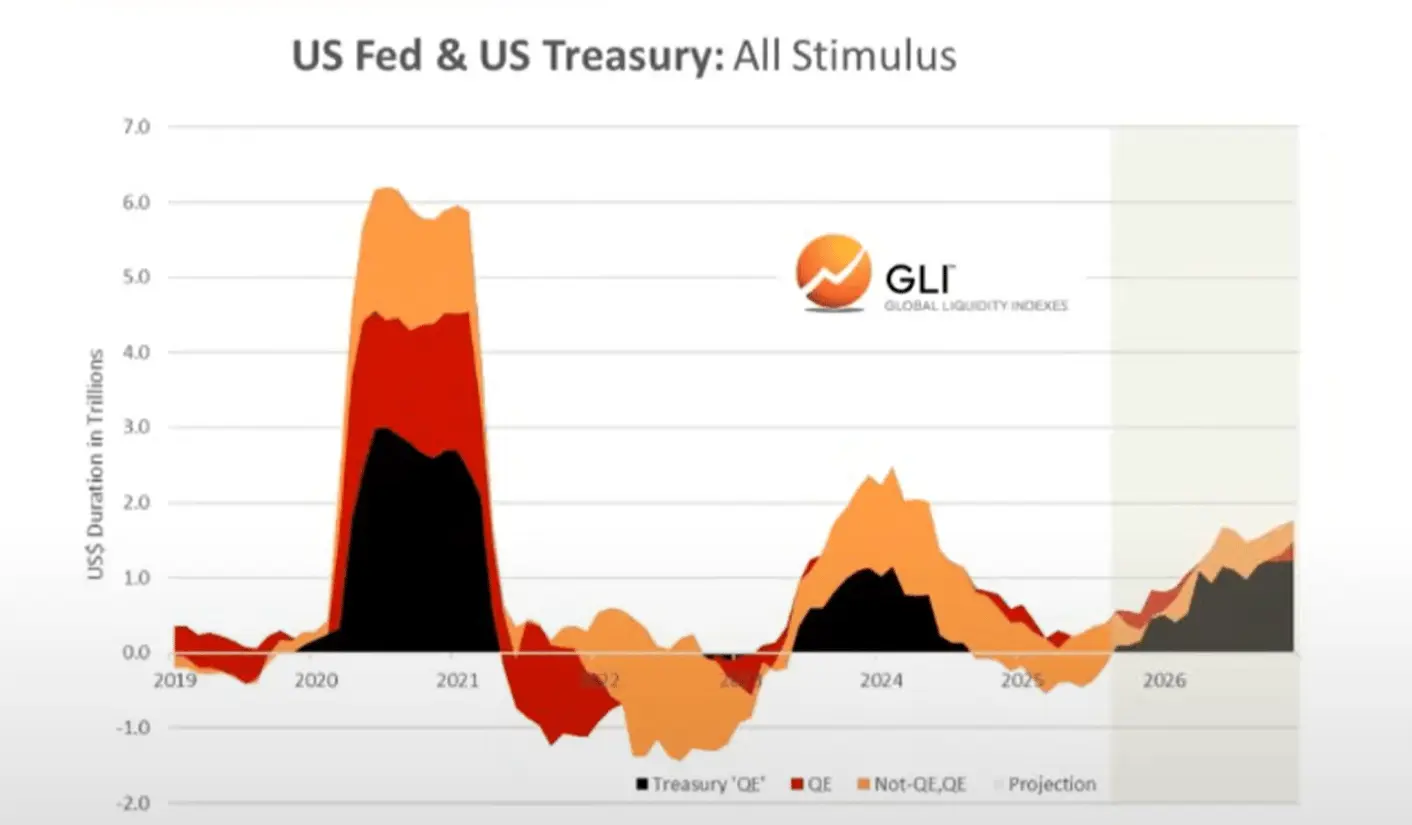
数据:Global Liquidity Index(全球流动性指数)
我们认为,正是财政支出和财政部量化宽松推动了我们在过去几年中看到的“贬值交易”和“万物泡沫”(“everything bubble”)的形成。
但现在我们正在向“特朗普经济”转型,由私营部门接过财政部的接力棒。
同样,这也是他们需要降息的原因。通过银行贷款来启动私营部门。
随着我们进入这个过渡期,全球流动性周期似乎正在见顶...
全球流动性周期正在见顶回落
当前周期与平均周期
在下方,我们可以观察到当前周期(红线)与自1970年以来的历史平均周期(灰线)的对比。
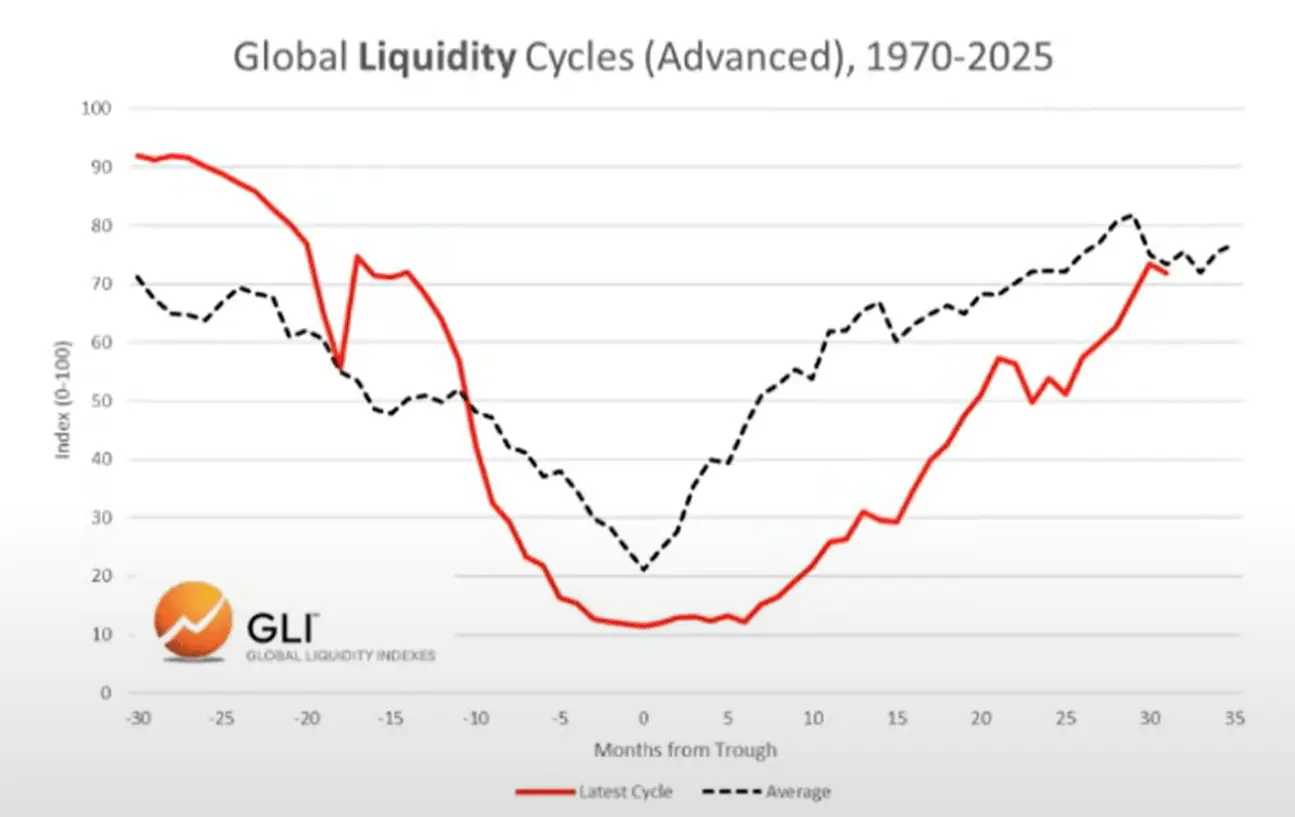
数据:Global Liquidity Index(全球流动性指数)
资产配置
基于霍威尔先生(Mr. Howell)在全球流动性指数方面的工作,我们可以观察到典型的流动性周期及其与资产配置的契合度。
大宗商品往往是最后下跌的资产,这正是我们今天所看到的(黄金、白银、铜、钯金)。
从这个角度来看,当前周期看起来非常典型。
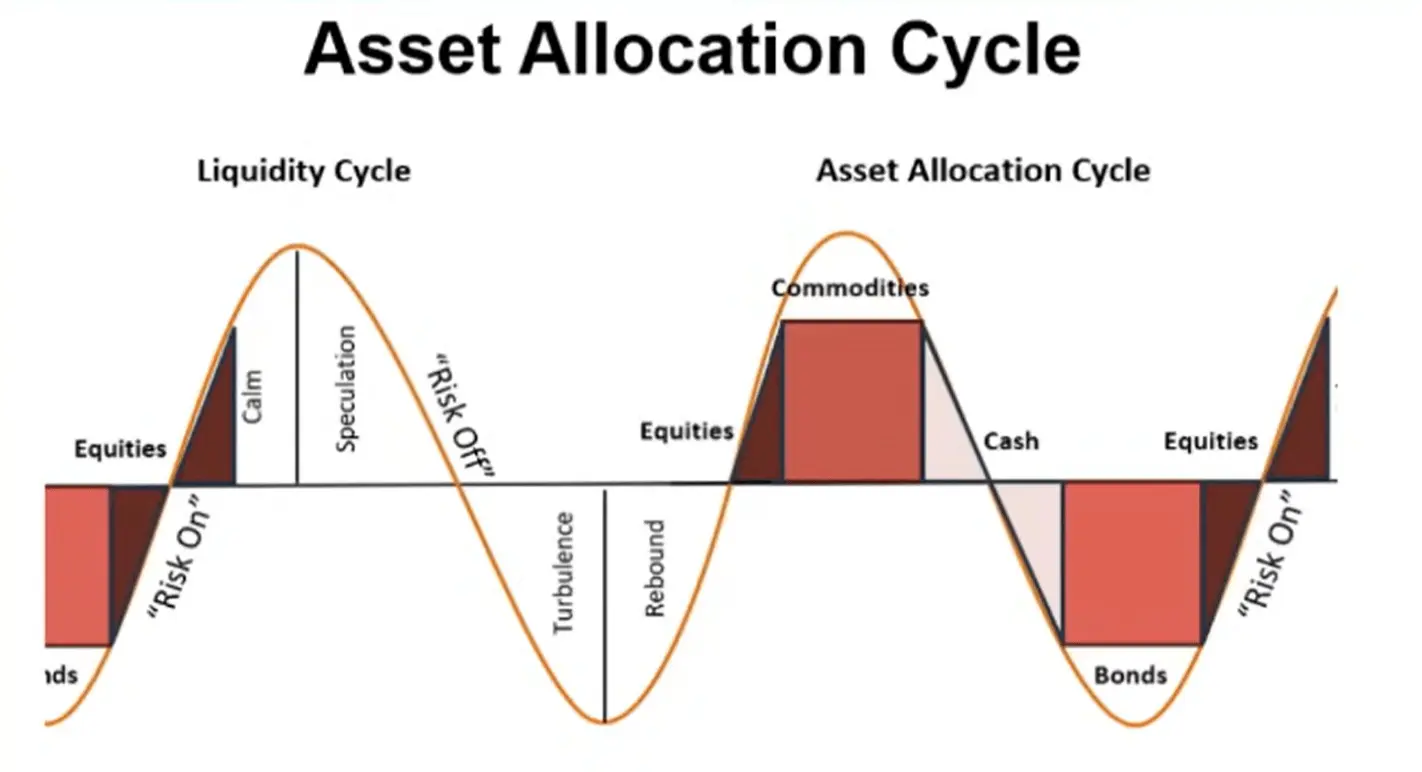
数据:Global Liquidity Index(全球流动性指数)
那么。如果流动性确实正在见顶,我们预计投资者将随着环境变化而轮换进入现金和债券。需要明确的是,这部分过程尚未开始(市场仍然“风险偏好”)。
债务与流动性
根据全球流动性指数,主要经济体的债务与流动性比率在去年底达到了自1980年以来的最低水平。它现在正在上升,预计将持续走高至2026年。
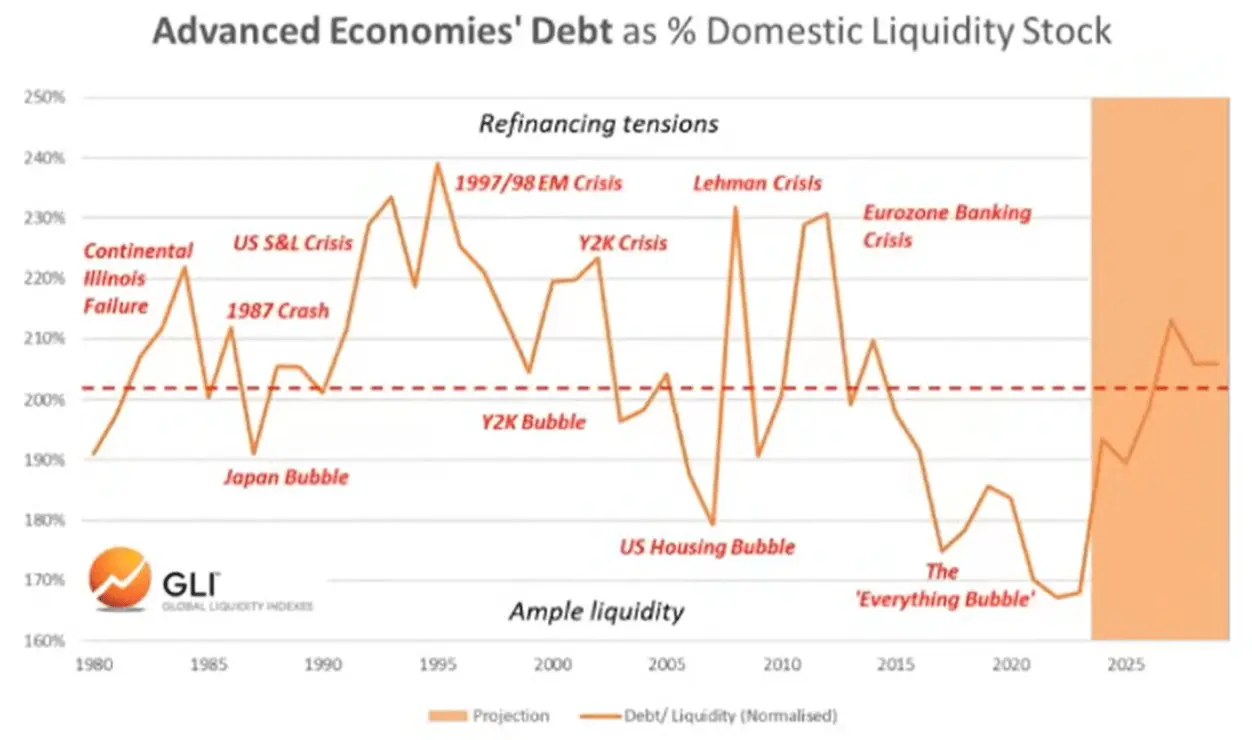
数据:Global Liquidity Index(全球流动性指数)
债务与流动性比率的上升使得为数万亿美元需要再融资的未偿债务提供服务变得更加困难。
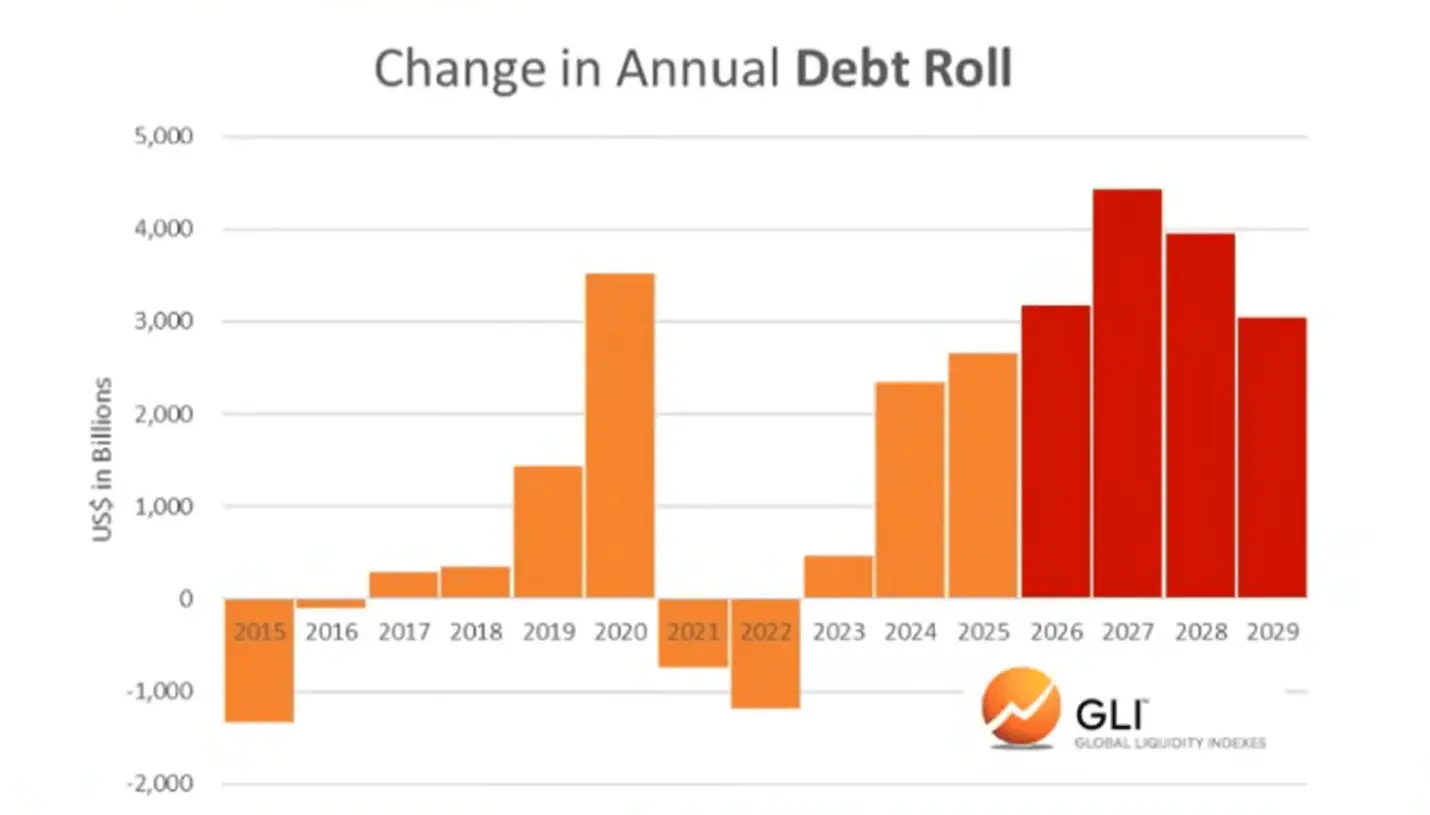
数据:Global Liquidity Index(全球流动性指数)
比特币与全球流动性
当然,比特币在过去两个周期中“预示了”全球流动性的见顶。换句话说,比特币在流动性见顶回落的几个月前达到峰值,似乎预料到了随后的下降。
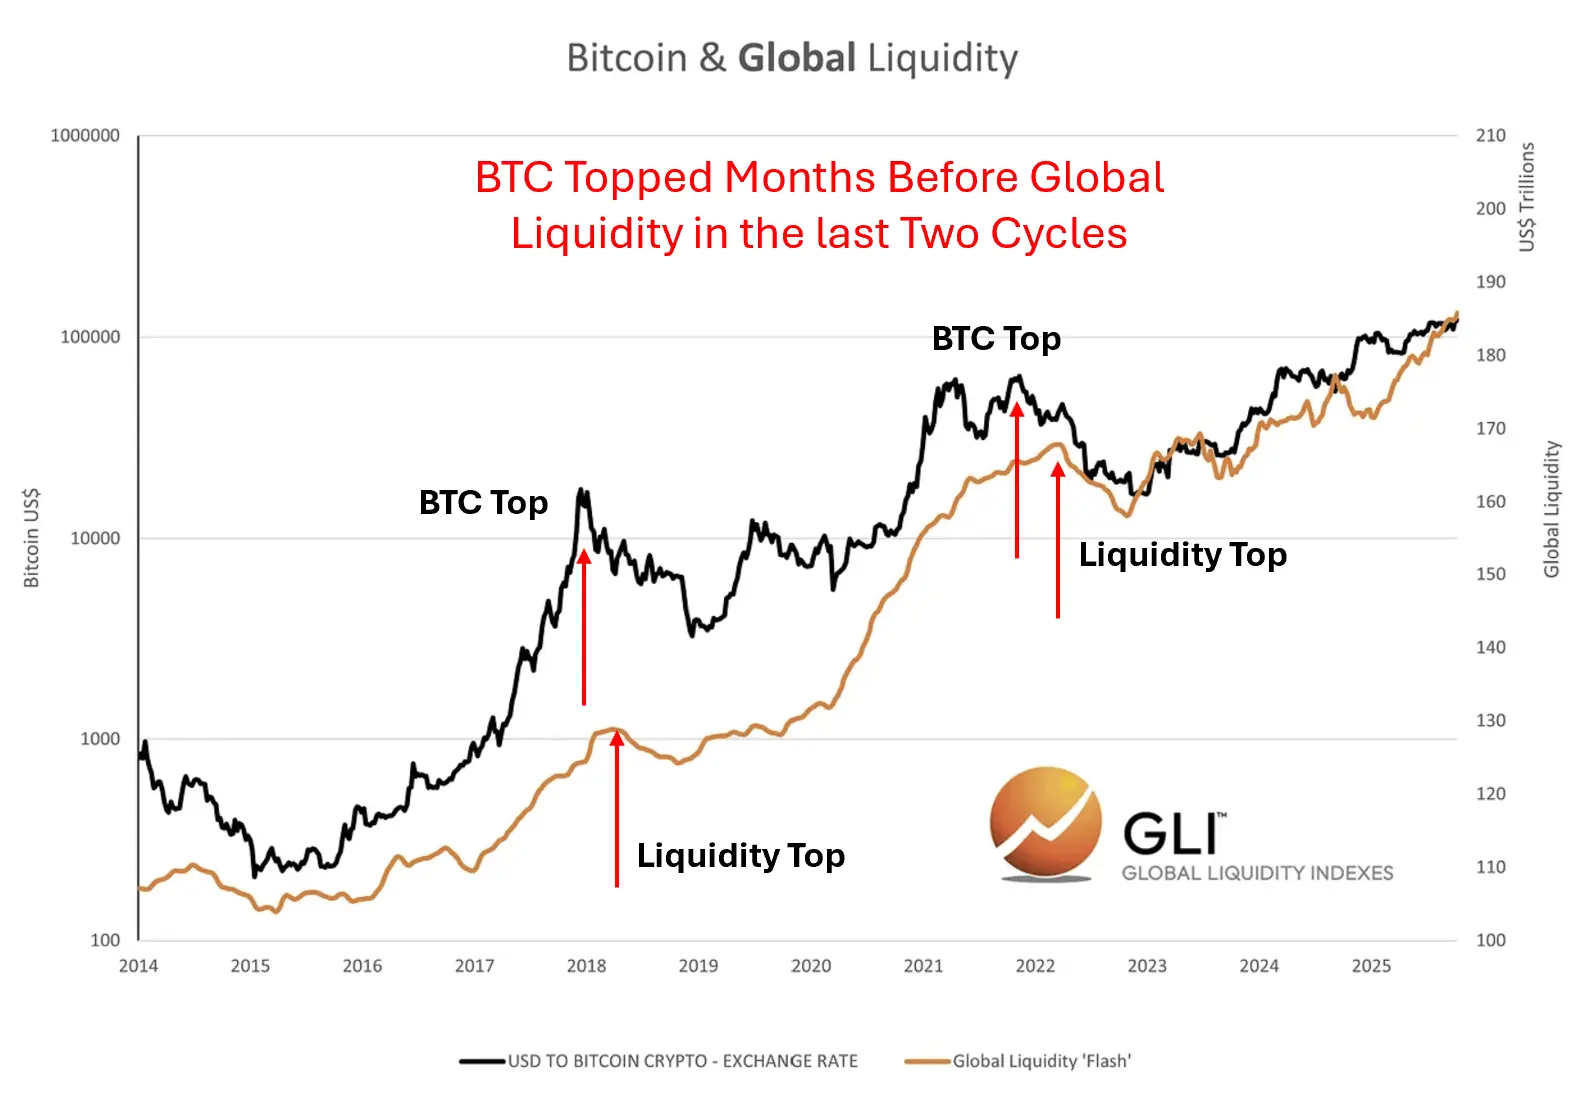
数据:Global Liquidity Index(全球流动性指数)
我们不知道这是否正在当下发生。但我们确实知道,加密货币周期一直紧随流动性周期。
与加密货币周期的契合
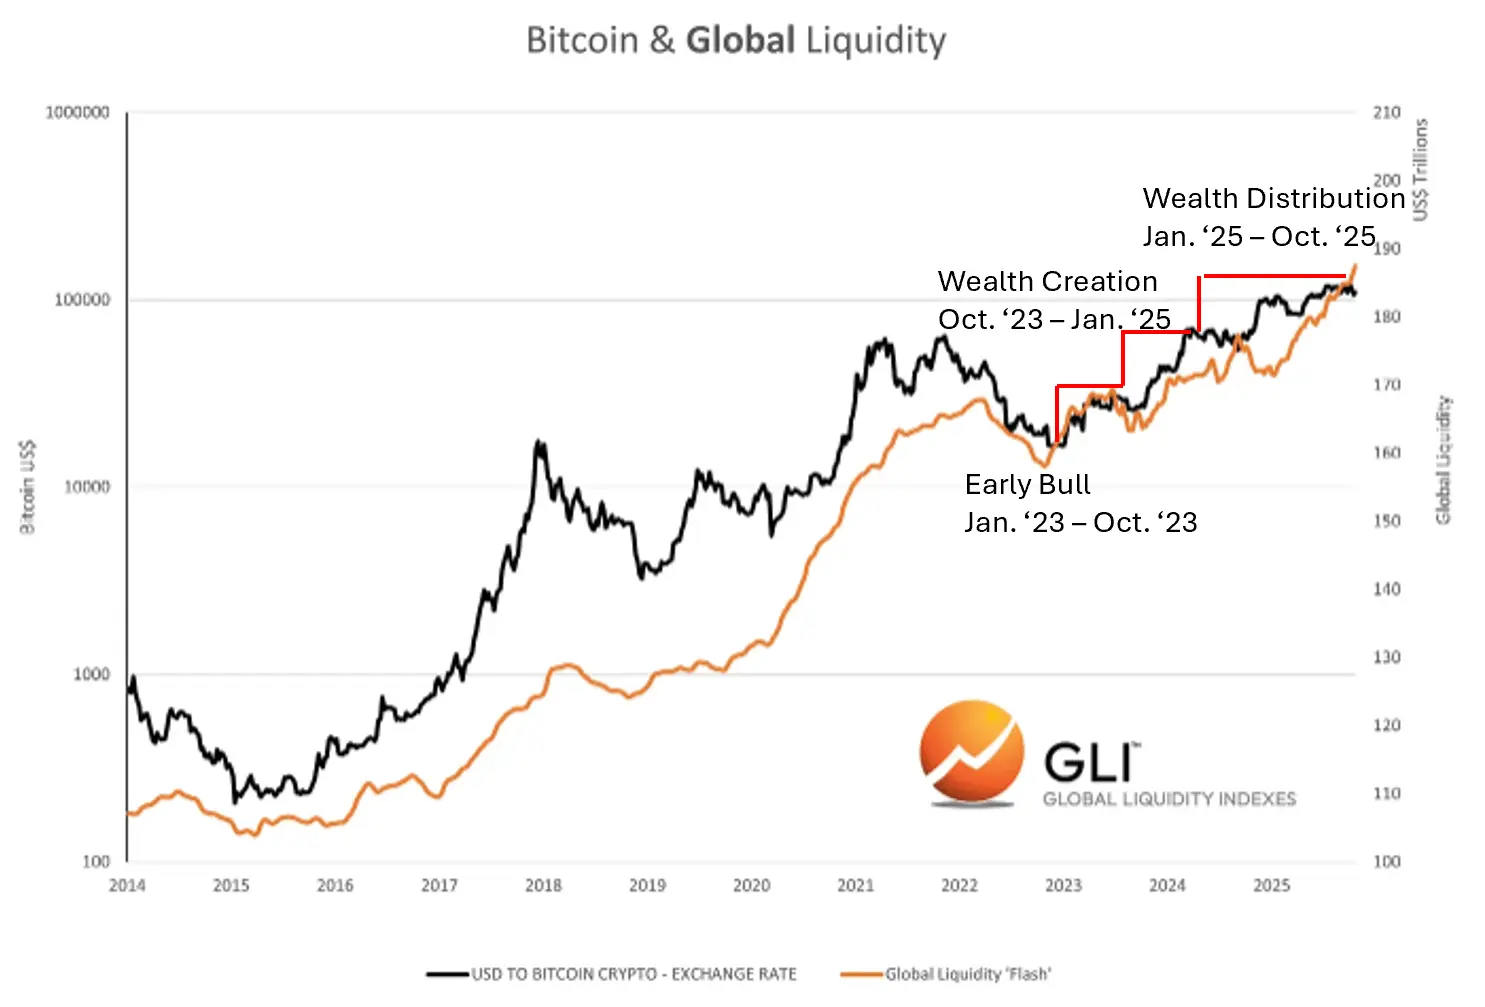
数据:Global Liquidity Index(全球流动性指数)
免责声明:本文章仅代表作者个人观点,不代表本平台的立场和观点。本文章仅供信息分享,不构成对任何人的任何投资建议。用户与作者之间的任何争议,与本平台无关。如网页中刊载的文章或图片涉及侵权,请提供相关的权利证明和身份证明发送邮件到support@aicoin.com,本平台相关工作人员将会进行核查。


