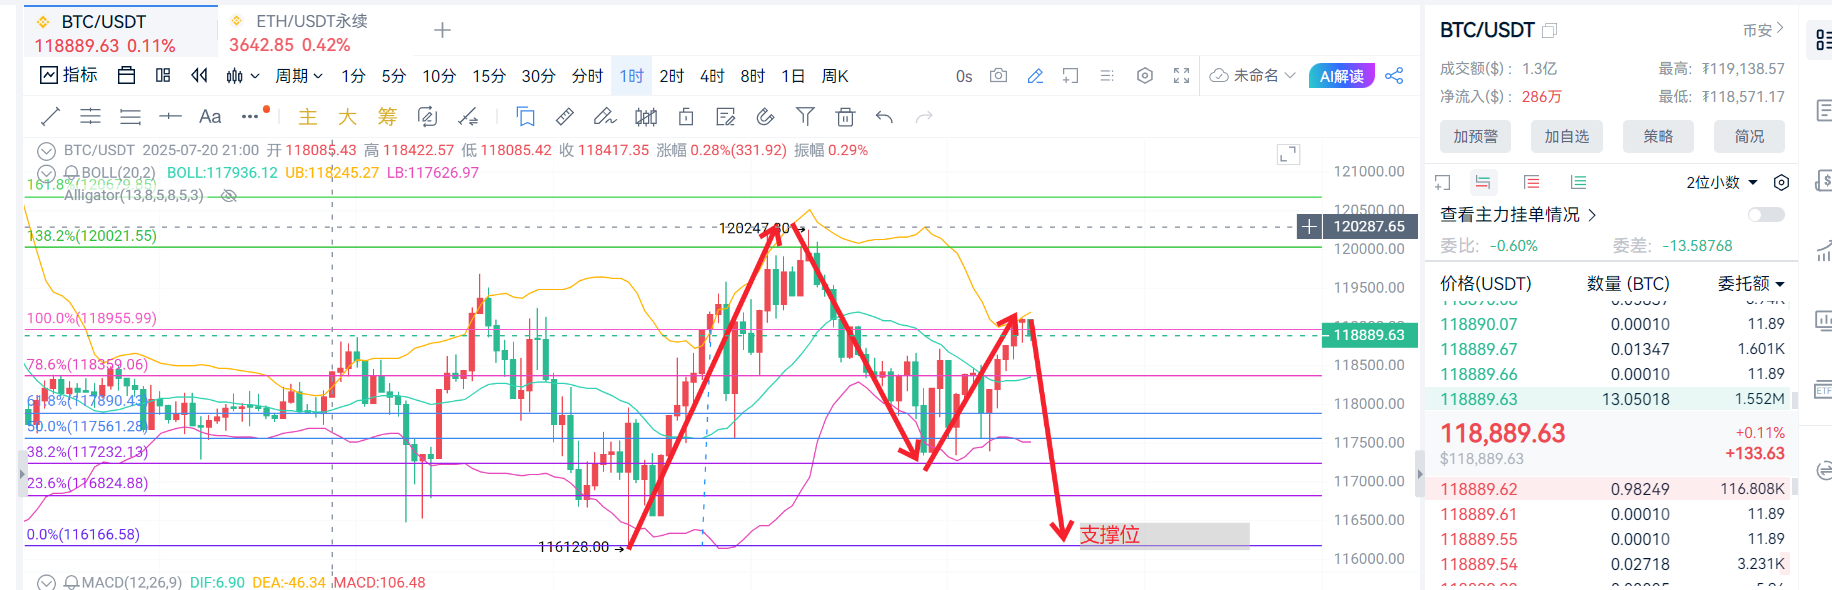
Today, Bitcoin is showing a high-level oscillation pattern, with prices fluctuating between $116,000 and $120,000 throughout the day, overall maintaining a high-level oscillation trend. Recently, Bitcoin's price has been highly volatile, continuously breaking through key resistance levels and setting new historical highs.
From the intraday price trend, after opening in the morning, there were signs of consolidation, hovering around $118,000. Subsequently, driven by bullish market funds, the price briefly surged above $119,000 but failed to effectively hold that level, followed by a slight pullback. As of the time of writing, the price is stabilizing around $119,000.
Analyzing the 4-hour candlestick chart, the price fluctuations are accompanied by an increase in trading volume, indicating active market trading and intense competition between bulls and bears. The MACD histogram remains positive but is gradually shortening, suggesting a weakening of bullish momentum; the KDJ indicator is in the overbought zone with a value of 91, indicating that the market is in a short-term overbought state, posing a risk of a pullback.
Bitcoin price operation suggestion: Buy on a pullback to $116,500-$117,000, with a target of $118,000-$120,000, and a stop-loss at $116,000. Bitcoin is currently at a critical point for directional choice; both technical indicators and capital flow support a bullish oscillation, but a breakthrough of key resistance levels is needed to confirm the continuation of the trend. Investors should closely monitor the combination of volume and price as well as changes in macro policies, adjusting strategies flexibly.
免责声明:本文章仅代表作者个人观点,不代表本平台的立场和观点。本文章仅供信息分享,不构成对任何人的任何投资建议。用户与作者之间的任何争议,与本平台无关。如网页中刊载的文章或图片涉及侵权,请提供相关的权利证明和身份证明发送邮件到support@aicoin.com,本平台相关工作人员将会进行核查。