狗狗币在经历了剧烈的反转后,稳定在0.170美元附近,显示出在宏观经济紧张局势扰动全球市场时的积累迹象。
这款模因加密货币在0.16美元处找到了强有力的支撑,目前正处于一个对称三角形内——这一技术形态通常预示着重大方向性变动的到来。
新闻背景
- 分析师们越来越关注DOGE的收紧技术结构。当前的对称三角形形态,加上成交量的压缩和波动性的缩小,暗示着突破可能即将到来。
- 这一形态的历史先例指向潜在的60%价格波动——尽管方向仍不明确。
- 随着美联储准备发布下一个政策指引,风险资产仍然承压,DOGE在突破点附近的定位可能为押注解决方案的交易者提供机会——或风险。
价格走势
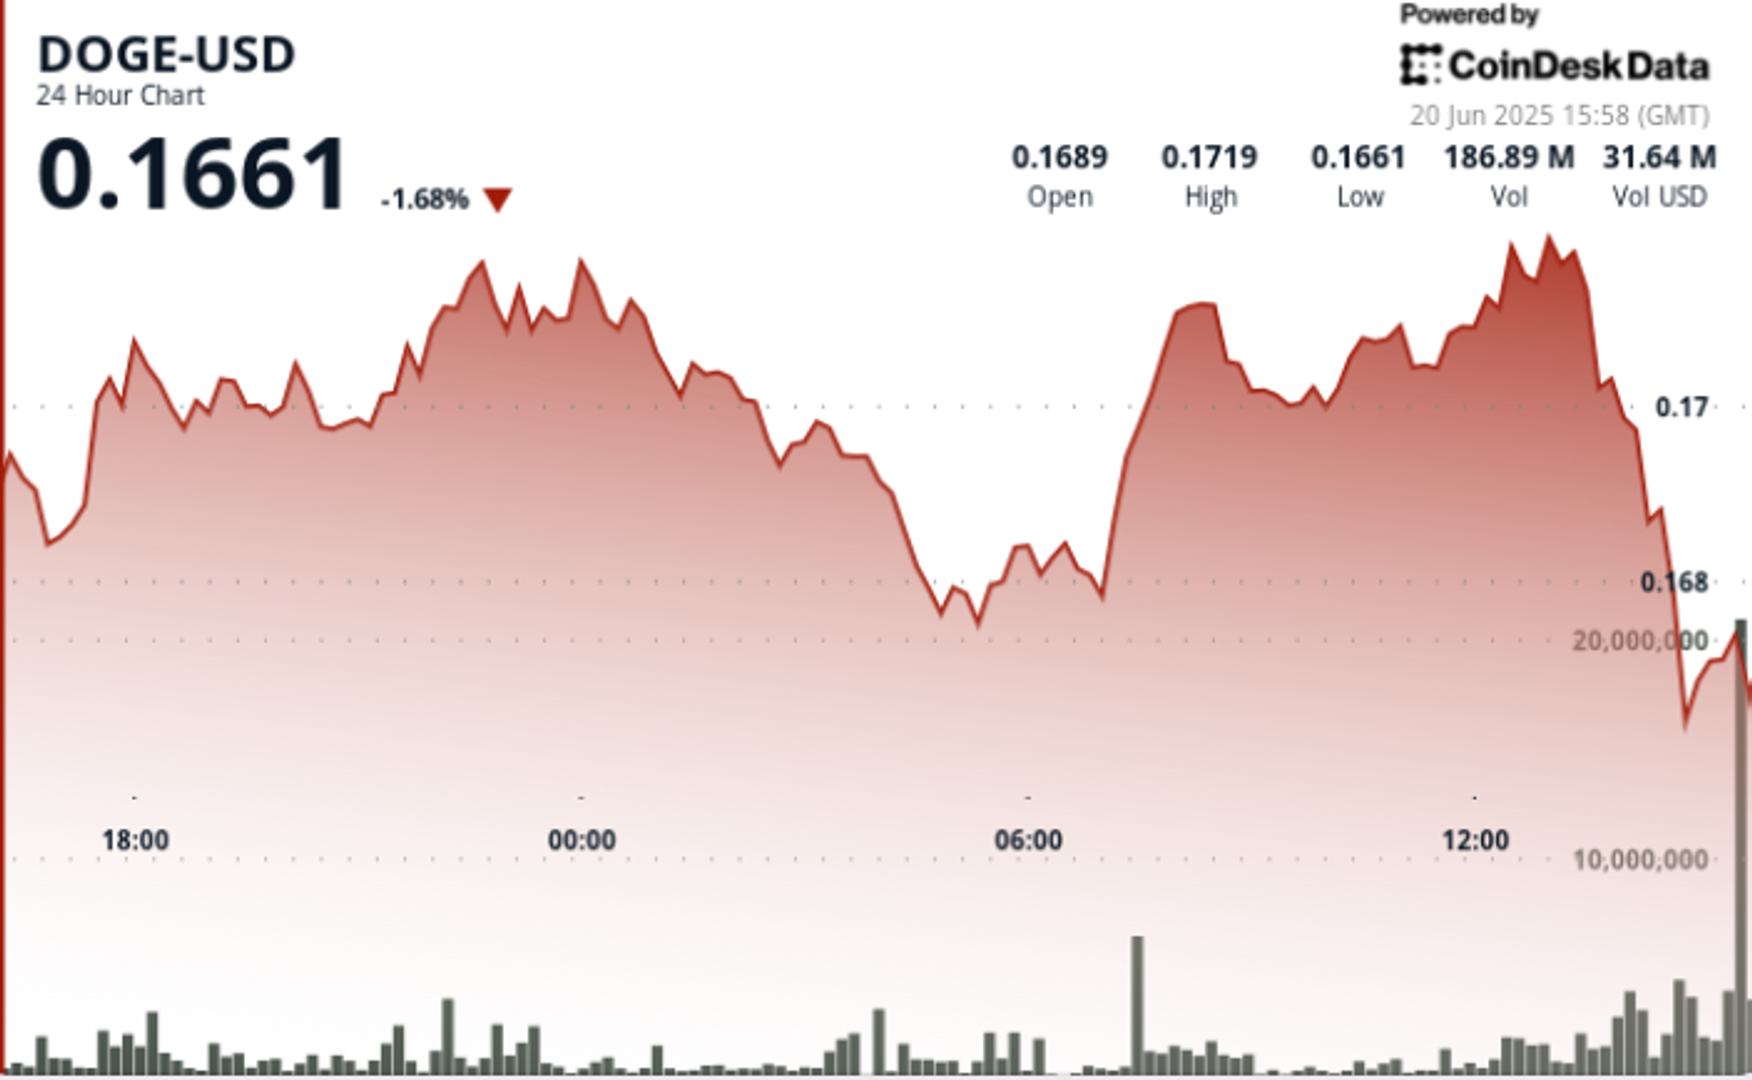
在过去24小时内,DOGE在0.167美元和0.172美元之间波动了2.7%。在04:00时出现了1.8%的急剧下跌,随后在07:00时强劲反弹,成交量激增至2.48亿单位——当天的最高点。该反弹巩固了0.168美元作为关键支撑位。
价格走势随后进入了0.170美元和0.172美元之间的整合阶段。在13:00时,尝试突破0.172美元的阻力遭到拒绝,卖出量为1.93亿。下行压力在13:45至13:51之间再次出现,成交量再次激增至1870万,但DOGE在0.170美元处稳住了阵脚。
技术分析回顾
- DOGE在24小时内的波动范围为2.7%,交易区间为0.167至0.172美元。
- 会期初的1.8%急剧下跌在0.168美元时以248M的成交量被逆转——现在确认作为支撑位。
- 在0.170至0.172美元之间建立了整合区间。
- 在高成交量的13:00时段,0.172美元的阻力被测试并拒绝(成交量为1.93亿)。
- 会期末的下跌使成交量激增至1870万;价格守住了0.170美元的底线。
- 对称三角形形态收紧,分析师预测突破时可能出现60%的波动。
- RSI徘徊在50附近;MACD趋平——动量指标反映出压缩阶段。
免责声明:本文章仅代表作者个人观点,不代表本平台的立场和观点。本文章仅供信息分享,不构成对任何人的任何投资建议。用户与作者之间的任何争议,与本平台无关。如网页中刊载的文章或图片涉及侵权,请提供相关的权利证明和身份证明发送邮件到support@aicoin.com,本平台相关工作人员将会进行核查。


