Bitcoin Price Watch: Bulls Eye $108K as Momentum Builds Across Lower Timeframes

CN
2 hours ago

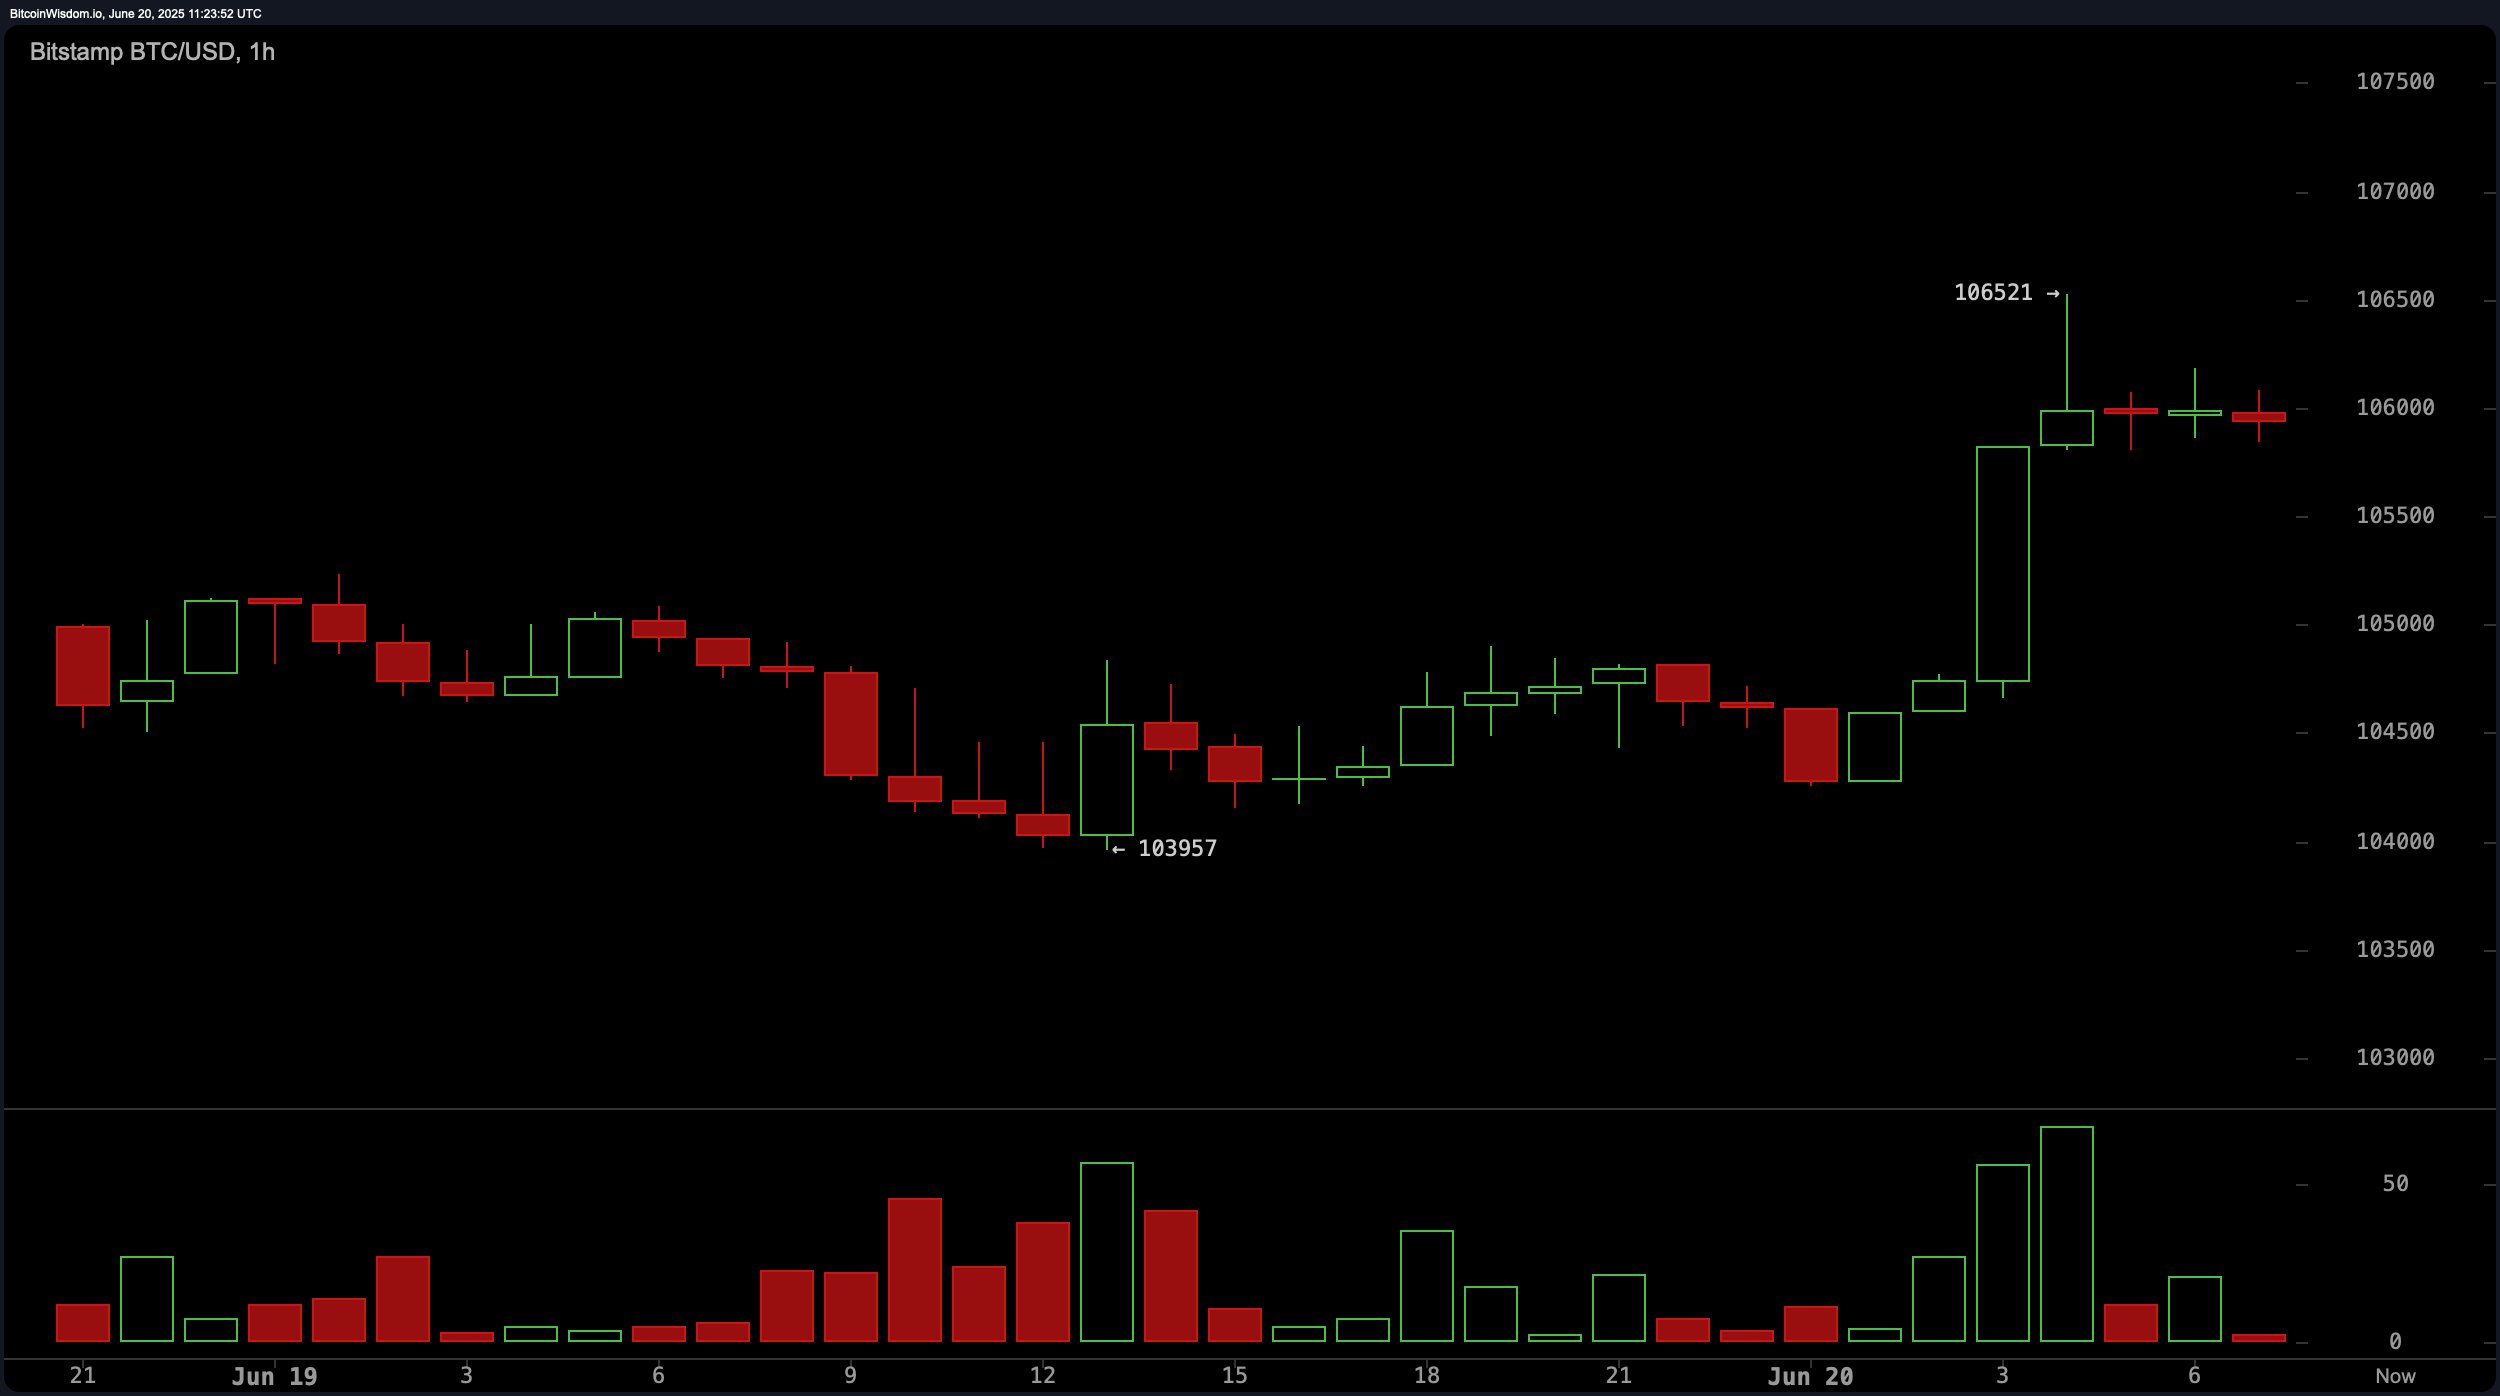
The 1-hour bitcoin chart reveals a short-term bullish breakout following the formation of a double bottom pattern at $103,957. Momentum accelerated sharply after the price pushed through $106,000, supported by a spike in green volume. Immediate resistance is noted at $106,521, the most recent high. Technical positioning favors entry on a retest above $106,000 or a clean break above $106,521. A retracement to $105,500 could offer a secondary entry opportunity.

Bitcoin Price Watch: Bulls Eye $108K as Momentum Builds Across Lower Timeframes

BTC/USD 1-hour chart via Bitstamp on June 20, 2025.

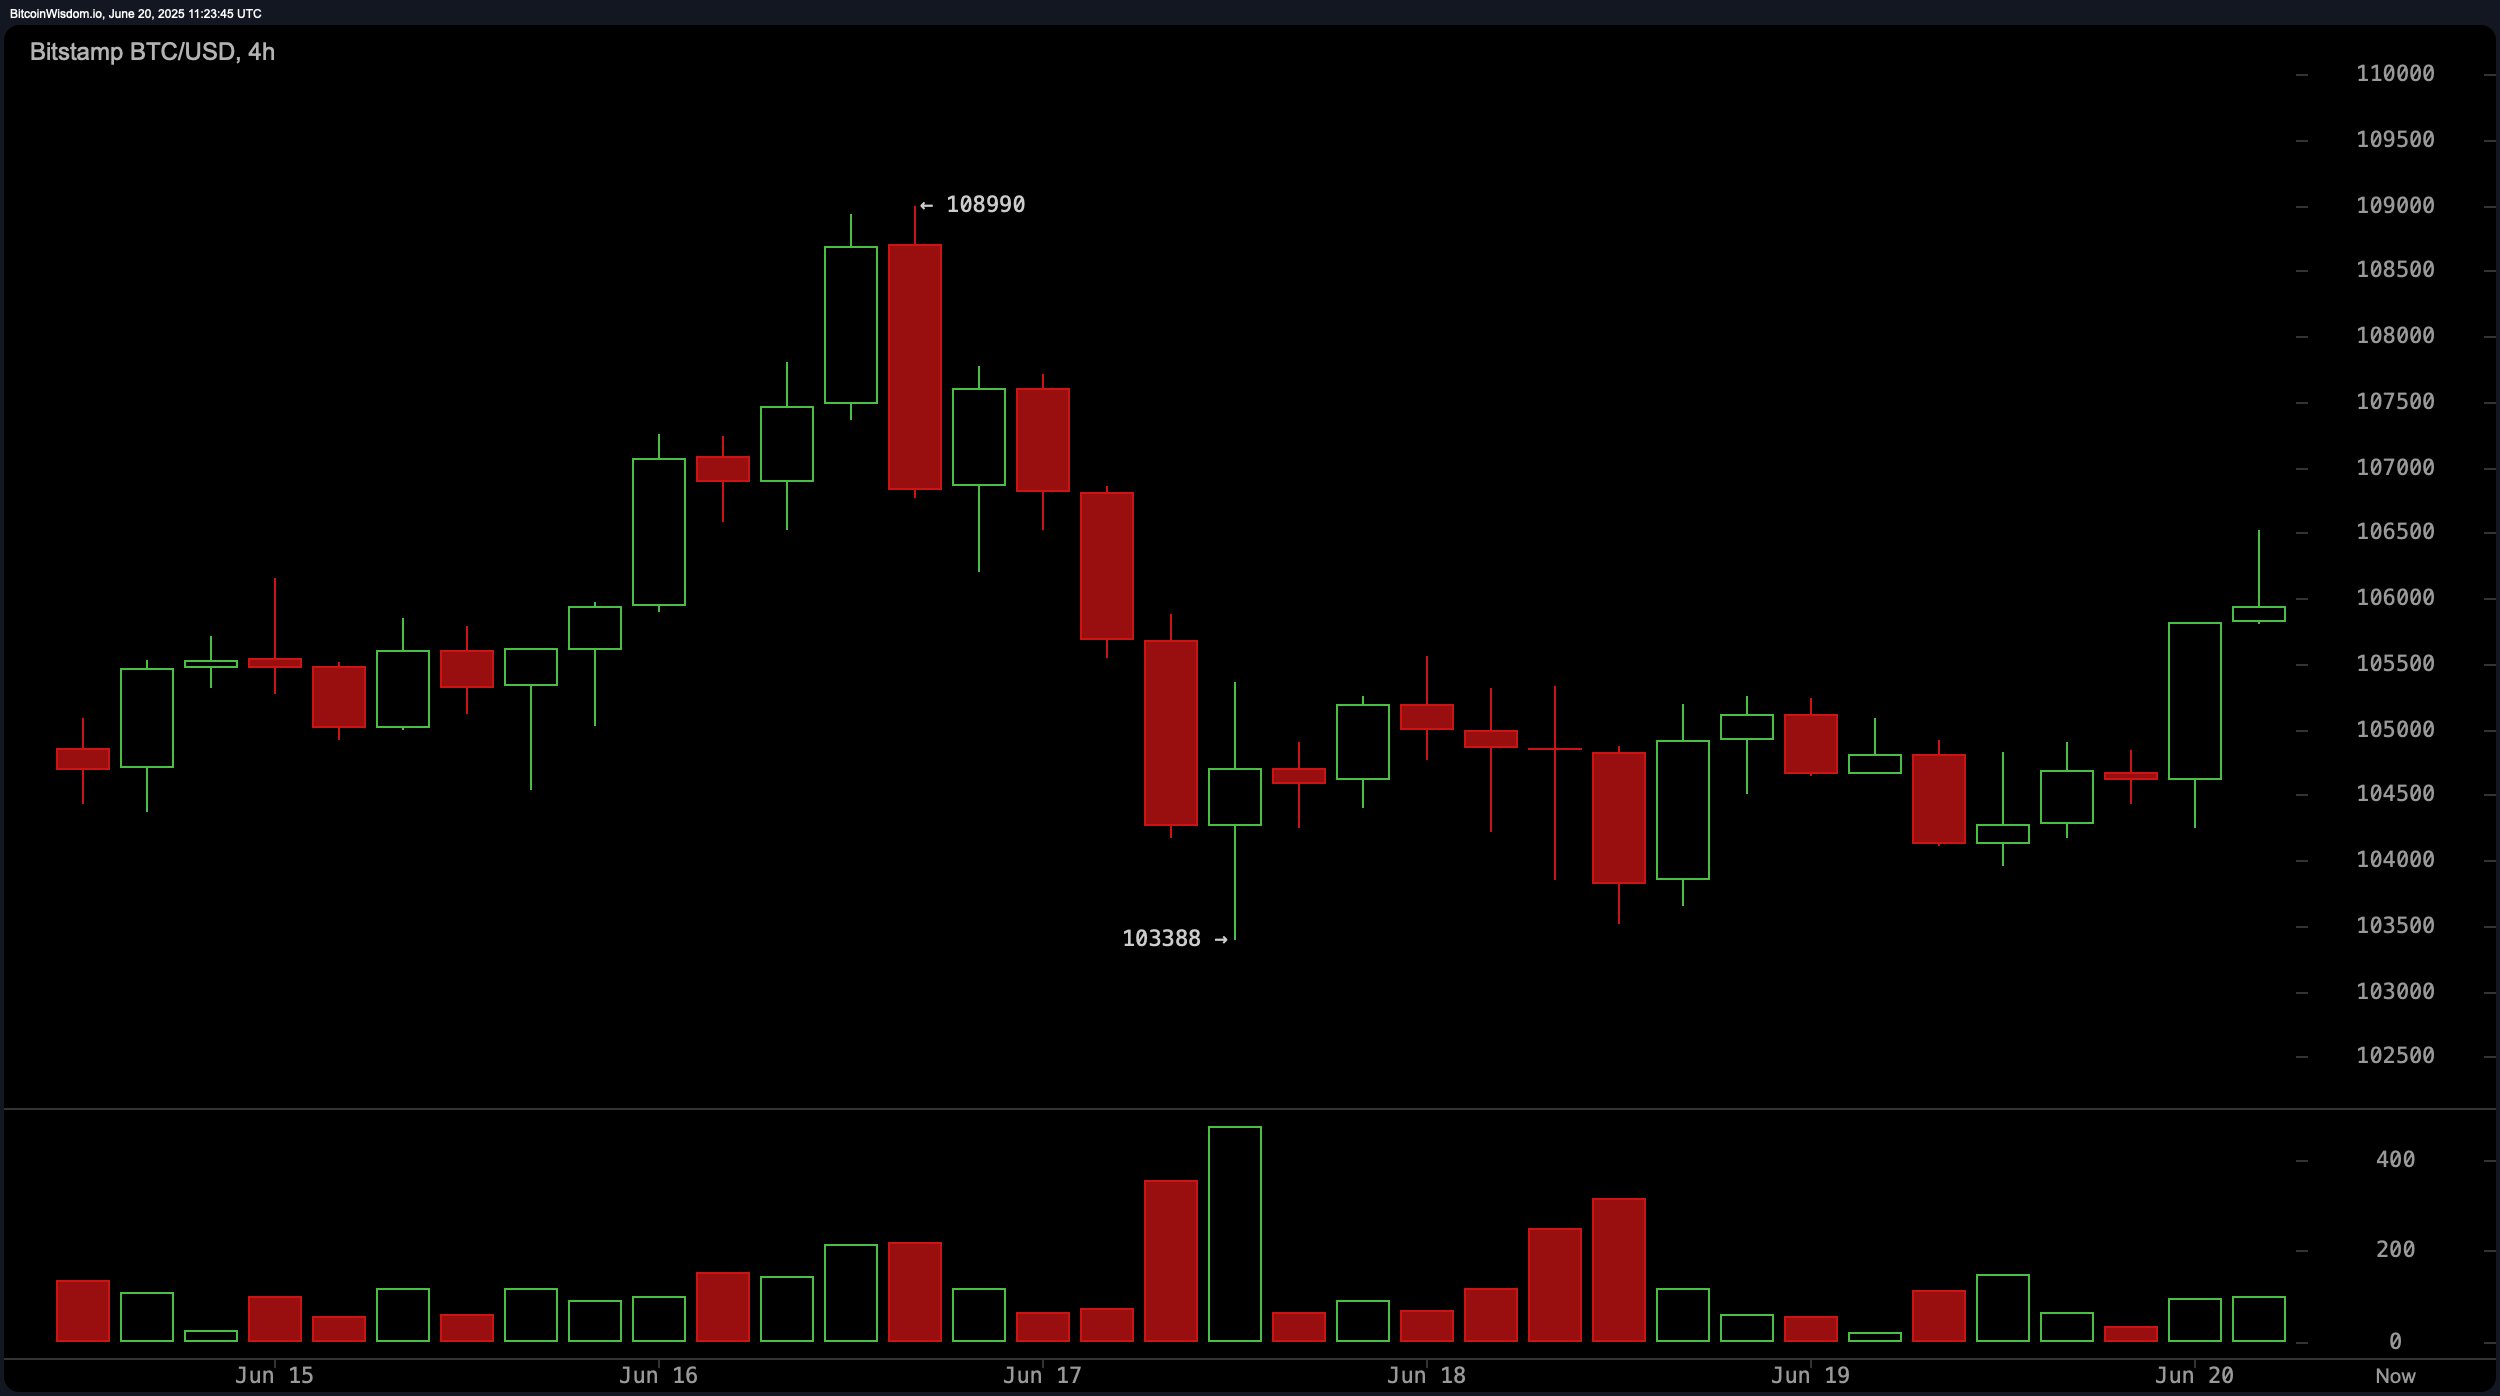
An analysis of the 4-hour bitcoin chart indicates a weak recovery phase from a recent dip to $103,388. The volume profile shows growing interest with upward candles, suggesting accumulation and building momentum. The rounded bottom structure suggests a potential shift in short-term sentiment. Buying strength is visible in the $105,500–$106,000 region, especially if $106,500 is surpassed with conviction.

Bitcoin Price Watch: Bulls Eye $108K as Momentum Builds Across Lower Timeframes

BTC/USD 4-hour chart via Bitstamp on June 20, 2025.

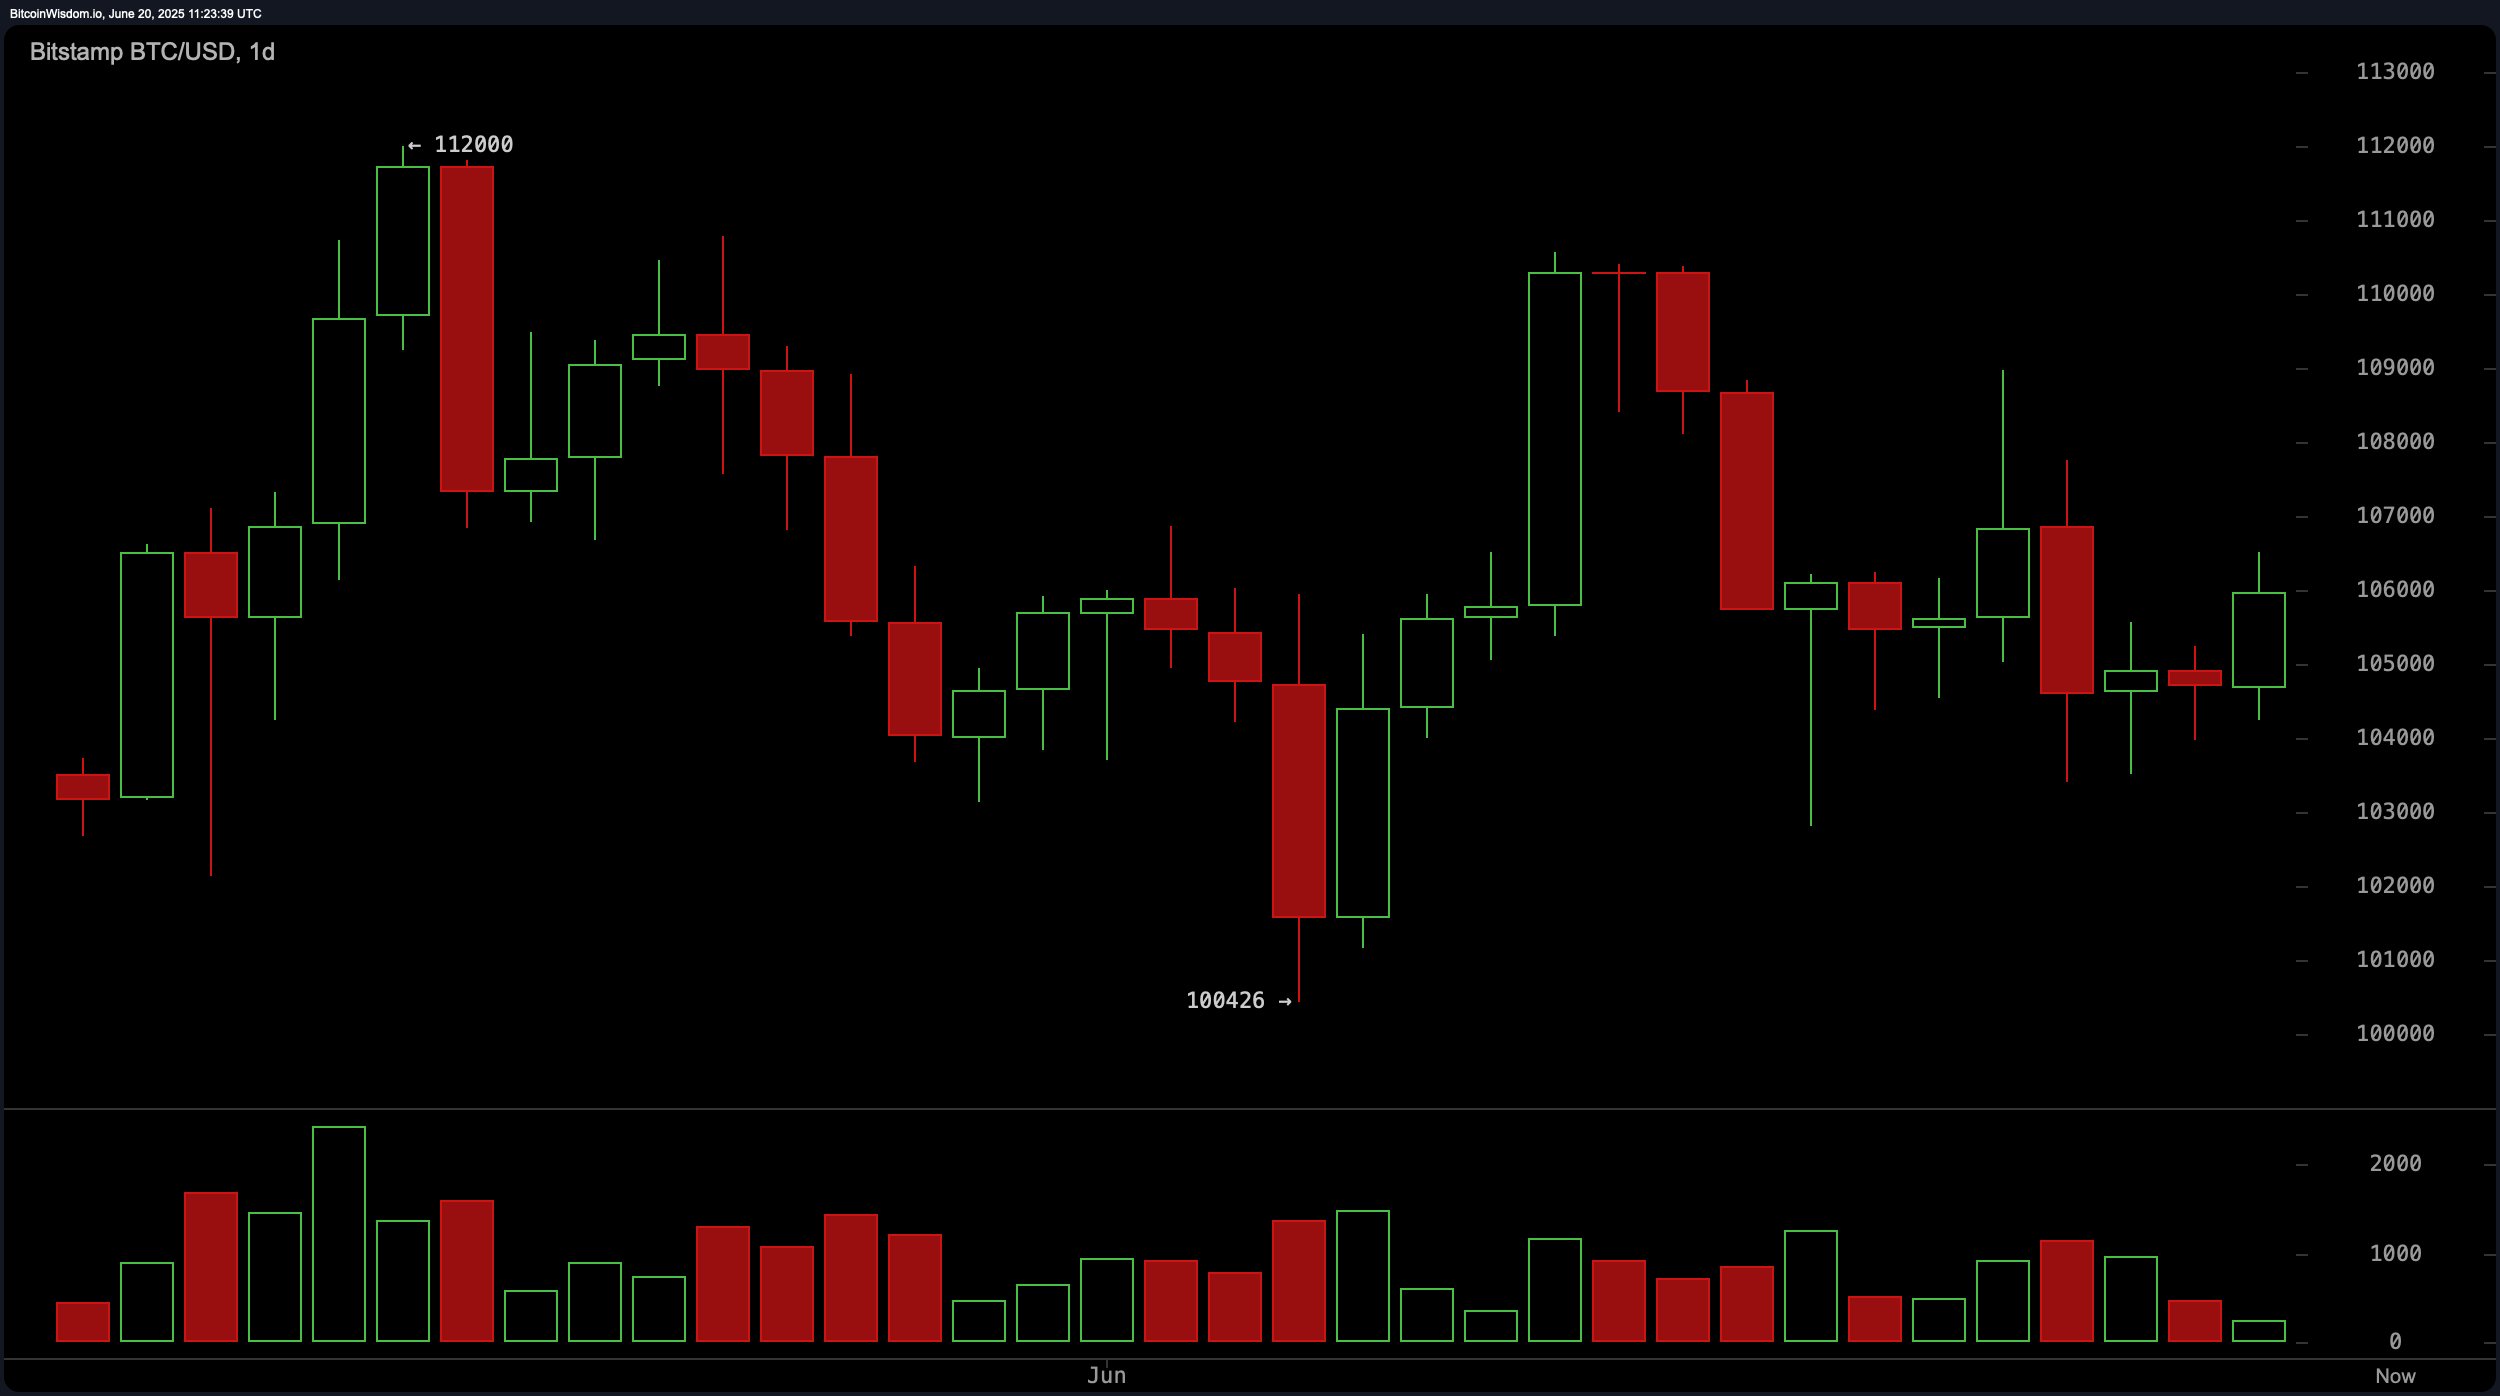
On the daily BTC/USD chart, bitcoin continues to exhibit a sideways trajectory with a slight bearish tilt. Price rejection from the $112,000 zone led to a drop toward $100,426, where it recently bounced but has failed to maintain levels above $105,000 with strength. A bearish flag pattern is forming, and declining volume suggests fading momentum. Technical strategists may consider initiating positions only if a daily close occurs above $107,500, with more reliable confirmation expected beyond $110,000.

Bitcoin Price Watch: Bulls Eye $108K as Momentum Builds Across Lower Timeframes

BTC/USD daily chart via Bitstamp on June 20, 2025.

Technical indicators provide mixed signals. Among oscillators, the relative strength index (RSI), Stochastic, commodity channel index (CCI), average directional index (ADX), and awesome oscillator all register neutral readings. The momentum oscillator, however, signals positive sentiment, while the moving average convergence divergence (MACD) shows negative reinforcement, emphasizing the underlying ambivalence in the directional trend. Moving averages (MAs) generally favor bullishness, with most short- to long-term exponential and simple moving averages indicating positive signals. Notably, only the 30-day simple moving average contradicts with a negative reading.

In conclusion, while the intraday charts exhibit a constructive tone and present opportunities for short-term positioning, the broader trend remains directionless with underlying bearish risks. Unless bitcoin reclaims territory above $110,000 with sustained volume, caution is advised. Traders are best served by maintaining tight risk controls and focusing on intraday momentum trades as the prevailing daily pattern continues to evolve.

Bull Verdict:

If bitcoin maintains momentum above the $106,000 mark and breaks through $106,521 with conviction, short-term traders could capitalize on bullish setups targeting $108,000–$109,000. The alignment of most moving averages on buy signals further supports the potential for an upward continuation, provided volume confirms the breakout and $107,500 is reclaimed on the daily close.

Bear Verdict:

Despite localized bullish patterns on shorter timeframes, the daily chart warns of a broader consolidation with downside risks. A failure to break above $107,500 or renewed selling near $106,450 could trigger a pullback toward the $103,000–$100,426 support zone, especially if accompanied by declining volume and MACD-confirmed bearish momentum.

免责声明:本文章仅代表作者个人观点,不代表本平台的立场和观点。本文章仅供信息分享,不构成对任何人的任何投资建议。用户与作者之间的任何争议,与本平台无关。如网页中刊载的文章或图片涉及侵权,请提供相关的权利证明和身份证明发送邮件到support@aicoin.com,本平台相关工作人员将会进行核查。

ad
Bitget: 注册返10%, 赢6200USDT大礼包
Ad
Share To
APP

X

Telegram

Facebook

Reddit

CopyLink