撰文:Dave 的游资视角
二级揭秘系列第二章:盘子兵法。上一章揭秘我们理清了二级概念和三种大框架模式。本篇将深入浅出继续探索,丰富我们的解盘武器库。 这篇文章会非常硬,大家其实讨厌不温不火的文章, 要么就纯粹逗个开心,要么就拿出绝对干货。但是大家也不用害怕,文章里我会讲原理的逻辑推导,也会讲可以直接死记硬背的特点,同时还会带上有趣的小故事。
《孙子兵法》是春秋时期孙武所著的兵书,共十三篇,每篇聚焦军事战略的不同方面。王安石称其「谋略深远,非止于兵」。借鉴前贤,【盘子兵法】总共 5 盘,片面概括了一些常见走势,目录:
-
合约盘
-
美式强庄盘
-
明牌庄家盘
-
威科夫发展模式
-
杂盘漫谈
孙子兵法《谋攻篇》里说,「知彼知己,百战不殆。」 话不多说,众将听令,正片开始。
1, 合约盘面
来吧把第一章里的坑填上,讲一讲操盘手通过合约现货联动盈利的方式,和我们能够看到的信号。先给大家发两个帖子,两位大师讲的非常详细,关于庄家逼空流程和原理。
https://x.com/wublockchain12/status/1805786970515537973
https://x.com/Michael_Liu93/status/1916131432193527842
从头讲,一阶段:吸筹起盘。
如果大家仔细看了我的第一章并且还记得的话,会想起来我里面说了一句话,就是操纵的故事秘密在于流动性。对于绝大多数庄家来说,他们赚钱的方式都是把价格炒上去,一定会有抬升价格这个环节。 那么既然有抬升价格的环节, 抬升阶段筹码就一定要集中,不然很上方抛压太大庄家风险太大,可能亏钱。 所以第一阶段是整理吸筹,所有庄家币都离不开这个阶段。
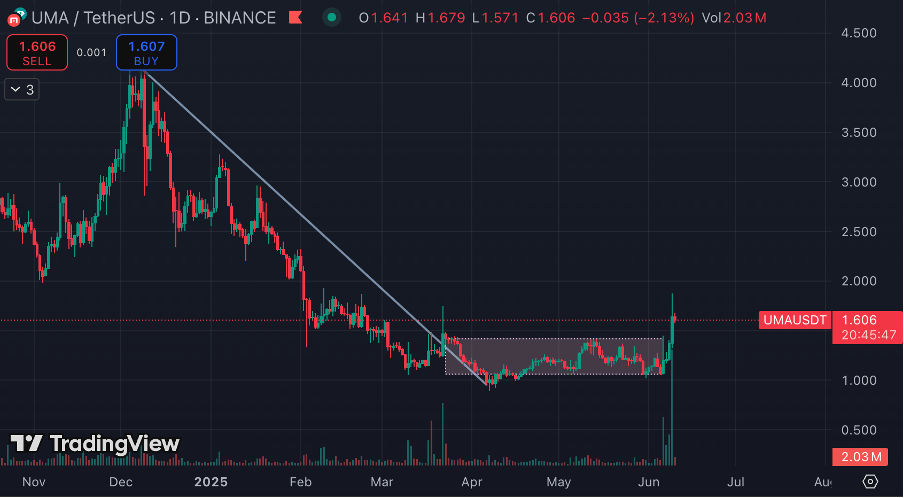
这个部分我就直接用这个 UMA 举例子了, 因为在写文的时候刚好做到了这个币。首先是吸筹阶段, 大家可以看到 UMA 从 24 年 12 月左右一直跌到了 25 年 3 月, 这个阶段是上一轮庄家结束操作了,现在筹码很松散,放任往下跌。但是从三月底开始放量走横盘,底部整理将近 3 个月,走完了结构比较饱满的箱体,这个就是吸筹阶段。
一阶段庄家完成了什么任务?
1, 低位吸筹控制流通。
2,筹集资金掌握控制盘口的能力。
3,反复试盘测市场水温。
接下来狗庄就可以开始二阶段操作了,二阶段:合约建立多仓。这是庄家入局手段,也是操作的开始。这里一定要给大家说 OI (open interest) 这个指标,这是未平仓合约的意思, 文章开头我说既会给大家讲原理也会讲死记硬背的特点,这里我不想推导了,直接说操作结论,当 oi 异常波动,尤其是剧烈上升的时候,大家需要警惕,这是开战信号。 对比我们说的吸筹阶段,这个信号更加直接,吸筹第一你不知道盘整有多久,第二横盘比较常见,你也说不好是不是真的有庄在后面吃?但是 oi 暴涨就是简单粗暴的信号了。所以可以简单记一下:小币妖币,oi 暴涨,整理充分,要起行情。
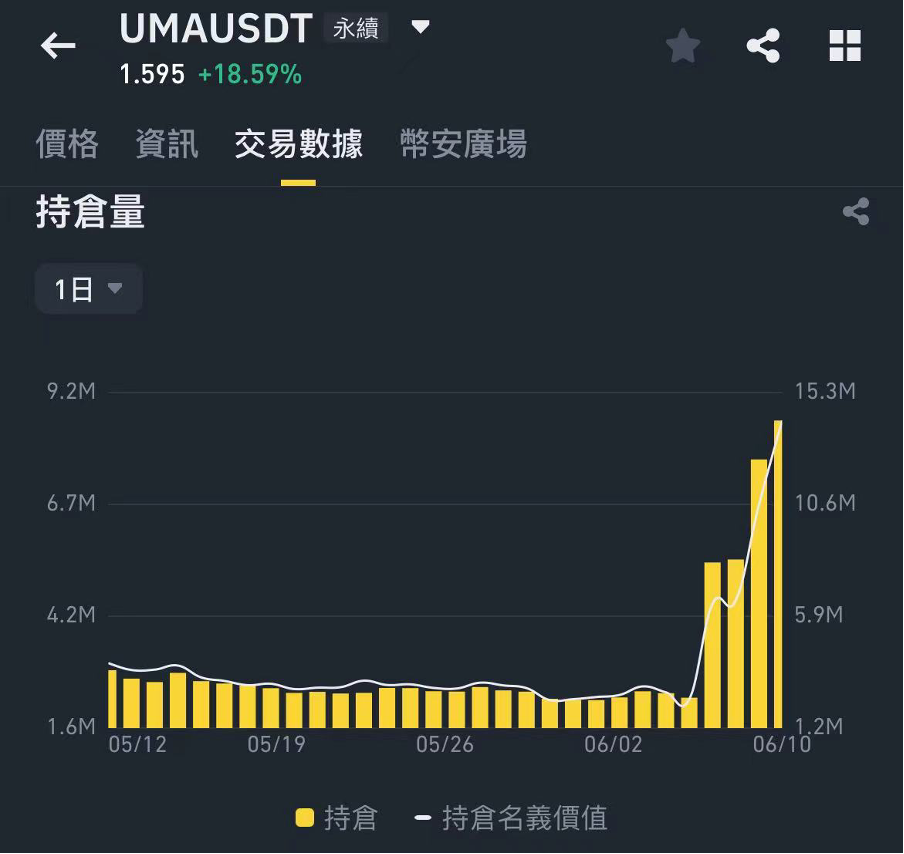
再用下 uma,oi 暴涨后过一会盘面就涨了。 虽然不是强因果,但我只想说明他们有很高的相关性。因为持有多单仓位是庄家盈利的关键一步,那庄家具体咋赚钱呢?
接下来是第三阶段,资金费率加爆空。
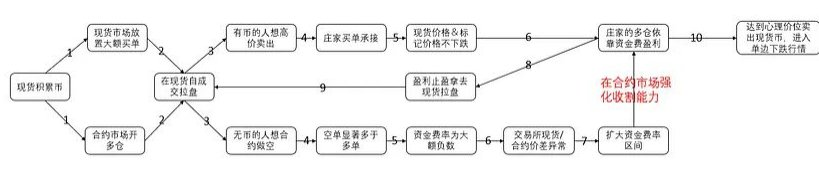
合约最新成交价格为了不跟现货最新成交价格脱锚,每 8 小时(现在是 1 小时)会通过资金费的形式,由多仓用户交给空仓用户,或者空仓用户交给多仓用户,并且将现货最新成交价格和合约最新成交价格缩小差距。所以对于多头庄家来说, 由于合约市场的空头人数是远大于现货市场的,毕竟现货市场卖单在庄家自己手里面,所以资金费率为负,空头会向多头支付费用。 在这种小币身上,资金费率通常是非常可观的,庄家光靠这一个现金流收入就能够赚一大笔。同时, 有了资金费率这个源源不断的钱,庄家会把收到的钱转入现货市场拉盘,这样爆掉合约的空单,庄家自己多单的盈利也会增加。最后, 不要忘了庄家自己手里是有现货的,低买高卖永远是主旋律。
所以我们可以总结庄家赚钱的手法:
资金费率,拉盘爆空,还有筹码出货。
但实际操作中不一定三者都有哈。最后崩盘流程,当庄家货也出完了,多仓也平掉了(oi 减少),他们就会像一个冷血将军一样果断抛弃这座没有价值的城池。
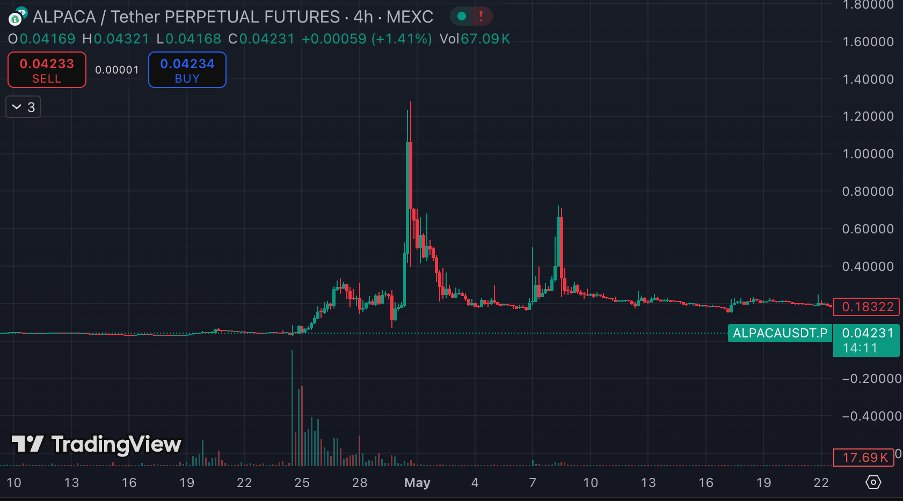
比如羊驼币, 操作结束后筹码就非常分散的让他自己跌了, 这里也给大家留个思考问题,羊驼币的操盘流程于筹码结构变化是什么?欢迎在评论区讨论。
第一篇合约盘就讲到这里,欢迎更专业的庄家集团指点。
2,美式强庄盘
美式常常是暴力美学的意思,把这一类发展模式归为美式强庄盘,一方面是因为他们确实是暴力美学拉盘,第二是因为常常非常巧合的,他们的庄家是来自北美的集团。这是一个要重点掌握的盘面模式。
美式强庄的特点是:
-
盘面强硬。买盘力量大,且涨幅可观。
-
持续时间较长。对所以币来说一般主升就 3 天,美式也不例外,但他们不会快速暴跌,常常以横代跌甚至小步阴涨。
-
没有舒服的上车位置。回调弱,涨的多,蜡烛图上的技术规律可以无视,导致只能观望不敢上车。
-
兵法如上,接下来看个实战:SOL
Solana 第一段属于美式强庄,后面是混合轮换,因为生态起来了。咱们看第一段,梳理一下。
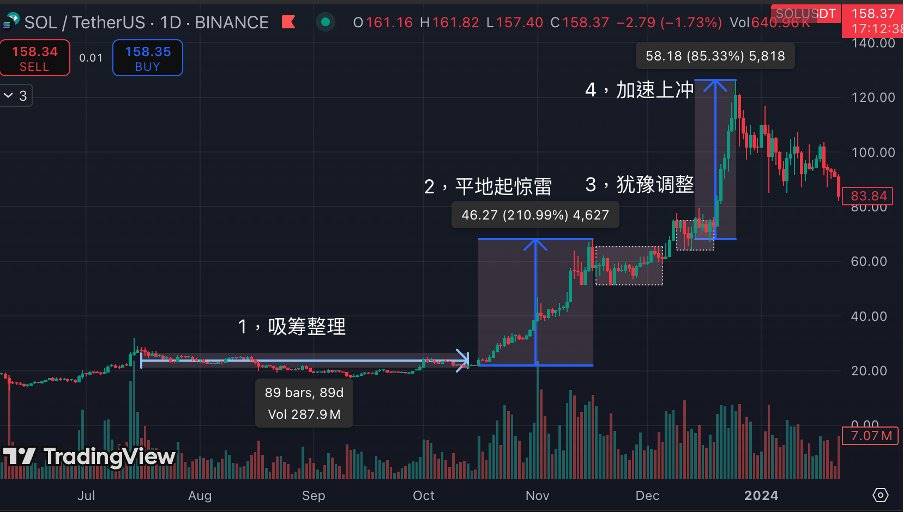
首先吸筹阶段,所以行情都逃不了吸筹阶段,就像高考,所有圆锥曲线大题逃不了方程式联立, 有种骗分方式就是你管他三七二十一先列出方程,蒙对一个总能拿 partial credit。 前期也是个比较经典的阴跌吸筹,在阴跌过程当中散户更容易没有耐心,其中的第二次回踩非常明显代表吸筹阶段,整个吸筹区键上下幅度大概达到 30%,其实不大,持续时间比较久,除非是坚定的持有者一般就卖了。
平地起惊雷,美式体质显现。我们炒币的时候怎么看出他是啥类型的盘子,就是在这种地方。 很随着大盘启动,sol 突然表现出非常强势领涨的势头, 在行情发展当中你单看蜡烛图会发现几个终止形态,也就是说,这个地方从蜡烛图技术分析应该看跌,但他根本没有管技术,直接往上打。 与此同时,生态基本面好像没啥大变化,消息面上好像也没啥决定性的利空,但是整个涨幅达到 210%, 这种一般就是机构进场了,比如说基金会融了一大笔钱开始拉盘。
犹豫调整期,整个回调期有两段平台,基本上都没怎么下跌,属于小震荡,看不出跌势。 尤其是调整期的第二个平台,在前高位置开始进行了一段漂亮的横盘,这个地方是很香的, 说明不是假突破,不是假的突破就说明这个盘子任然非常强势,庄可能会有计划出货,但不会来A 字斩。这种就可以 ride the bubble 赌最后一波。
最后就是加速上冲,庄家发动最后一波纯粹是跟着大盘走一个大趋势,然后预期和承接到了嘛,往上拉一波情绪有多高就涨多高。
从交易的角度反思,首先第二阶段平地起惊雷是这个盘子的特点阶段, 不一定每一个盘子都能像 sol 一样做出完整的三浪。 所以我们其实应该在第二部就抓住了,这个时候你返回去看一下第二段,是不是没有找到合适的上车位置? 没有就对了这就是美式的特点,不敢上的 https://x.com/0xDave852/status/1918142304105427063
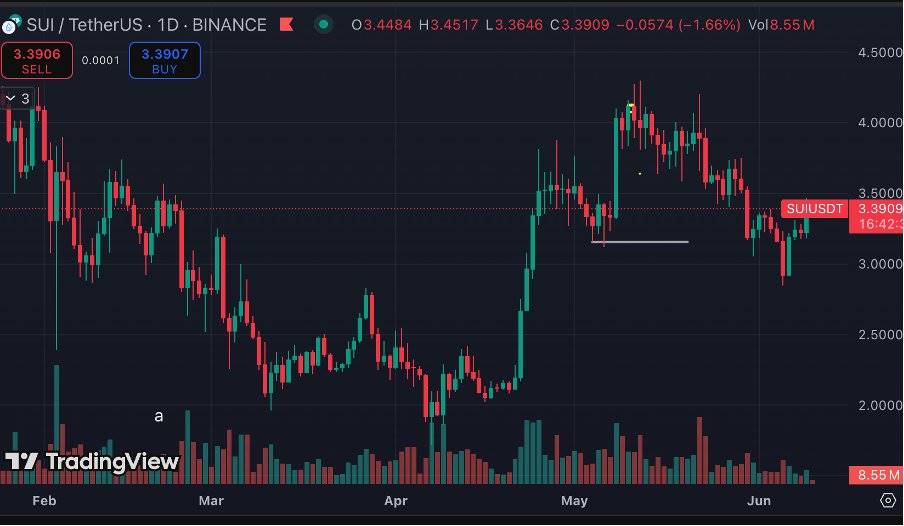
上面这个链接是我另外一篇长文,专门分析了 SUI,也是一个美式强庄,大家可以去看一下,我当时找的位置就在第二阶段末期,第三节能不能起来就得赌了。
Sol 第三阶段很重要,他给我们很大的信心去向上做。
我刚刚在分析的时候说了一个词叫A 字斩, 大家可能不知道啥意思,我给你看一下什么叫A 字斩。
Layer:
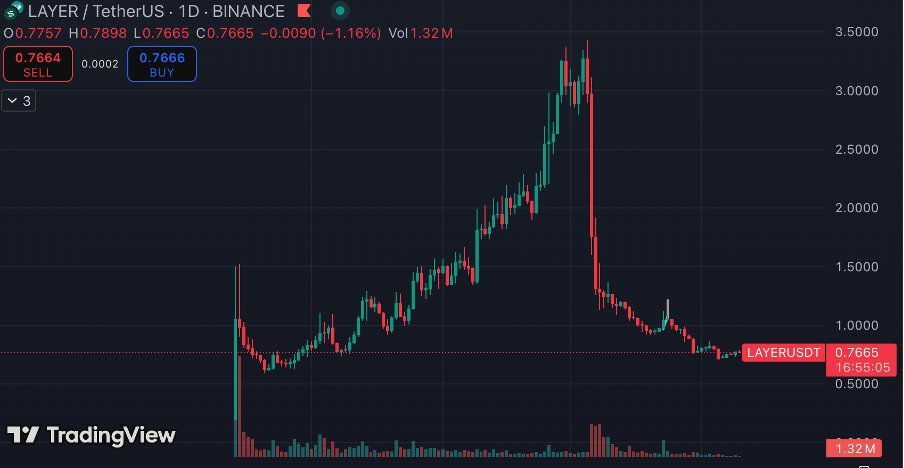
标准的美式强庄接 A 字斩,在前面的拉盘过程当中你根本找不到上车位置,推土机一般向上,最后一根线直接砸一半, 但人家庄家成本很低的, 自己做过这个币的话就知道他们的操盘水平在一般币种之上, 一套连招非常华丽,大家在战场上一定要小心。
第三阶段要给大家提个醒,纸上谈兵你可能觉得很好做,但实盘做进去的话非常有可能亏,因为你老是会被插针损掉。
那么怎么操作呢?我们从盘面强度判断出他是美式强庄过后, 上策是抓住平地起惊雷的阶段, 这里不要怕,要敢追高。 你找不出逻辑,大家说不出原因,那就对了,冲。 第二个方法是去找团队和背景信息,大家可以细读一下我的夜的第七庄这篇文章, 从超越技术面和基本面的维度分析发展潜力。 最后就是尽量做突破交易, 你看了 SOL 的第三阶段,觉得是个很甜的入场,你再看一下 layer 呢,如果你在上面的盘整入场的话不就寄了吗? 那么带止损会不会好一点呢? 有止损的话在盘整阶段容易被插掉, 这个确实要亲自下场打过仗才知道,这个阶段向上向下骗是非常多的。 所以你要吗区间底部承接,给个保守止损,要么做突破。
大家看了这么多有点累了,一个非常有意思的花边是,上面发出的三个币种他们团队和主要机构就是北美的,所以把它们叫做美式强庄还真有那么点道理。
上述盘形出现范围比较广,同时利润丰厚,而且特征明显,值得大家重点看看。
3, 明牌庄家盘
明牌庄家这个名字就非常有意思,庄都是躲在幕后的,怎么能叫明牌呢? 第三种盘面模式判断主要是依靠场外招了,或者说综合判断,靠逻辑推理与抓资金的蛛丝马迹。明牌庄家盘属于我们第一章二级揭秘所讲的指定人视角解读。
盘面原理是,有这样一个指定的庄家集团,为了达成某种目的,必须拉升一个代币价格。因为我们知道操控价格不只是为了获利,也可以「拉出信仰」,拉盘是有很多益处的行为,比如引起声量,当然需要控制好成本。
这种盘子的二级特点比较各异,但是发展逻辑可以总结, 其中比较经典的思路是「一个带一窝」的打法, 拉盘某一个指定代币后, 可以因为造富效应带动整个板块或生态代币, 实现长线视角上的大收益。 同时还有一个比较经典的思路是「箭在弦上不得不拉」,如果不拉盘某一个资产的价格,那整个战线都可能遭受打击,比如 mstr, 我一直在关注这个股票,很有体感,我们都知道 MSTR 上涨的时候倍数是远远高于比特币的,但是下跌的时候咬的其实不是很紧,甚至在底部你可以感觉 mstr 明显的强势, 这可能就是因为如果放任股价下跌的话会引起连环清算,所以有力量在护盘。
以上两种我们都会举例说明, 其实说实话二级盘面上的东西更好量化,说到资本市场和情绪市场反而有点玄乎,但这也正是拉开交易员水平的地方,我们从例子中一起感受吧!
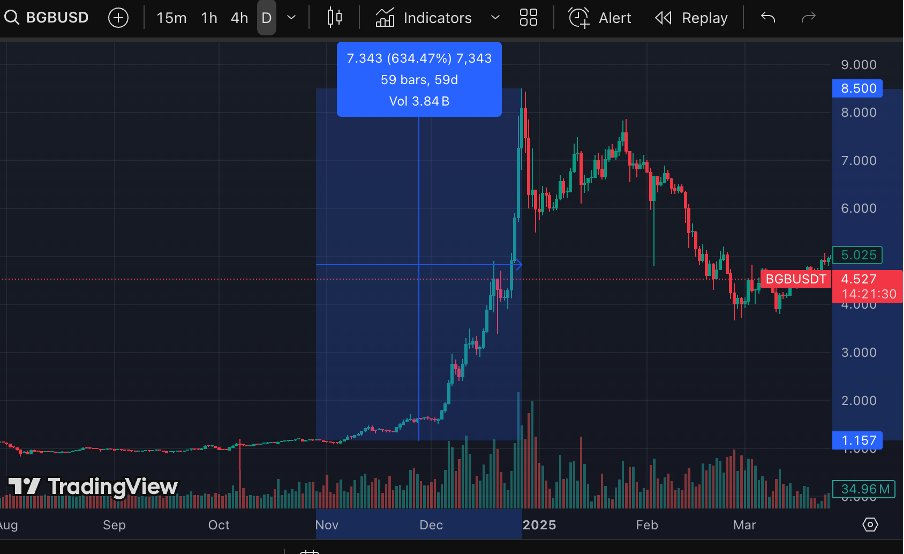
3.1 拉出信仰:BGB
BGB 是 Bitget 交易所的平台币,目前只在 Bitget & MECX 上有现货交易对, 也被戏称为某种程度上的单机币。 从 2024 年 10 月底到 12 月底,BGB 价格拉升六倍以上,是一个强势的明牌拉盘。
接下来梳理一下判断 BGB 机会的几个重点信号:
1, 主观拉盘逻辑:白热化竞争中拉出热度。 回到去年年底,交易所竞争正式进入白热化阶段,存量用户搏杀,增量用户瓶颈的难题限制了市场上每一家 CEX,再加上 Hyper 异军突起, 中心化交易所的份额之争非常激烈。 各大交易所也先后开始自救计划,比如 BGB 的造富爆发。 我身边还真有挺多朋友是吃满了这一波的,交易所拉盘平台币 在当时几乎成为了一个明牌热点, 我记得最夸张的时候小红书上都可以刷到,说她男朋友靠 bgb 赚了 80 万, 轰轰烈烈的一级消息面和二期盘面联动,确实把 bitget 推到了圈外。 同时也为大家注入了很大的信心,一个很好的例子就是身边挺多低价买了 BGB 的朋友没有在高点卖出,而是高点下 40% 50% 卖出的, 这就说明在高点的时候,大家是真的有信仰。
2, 客观拉盘原因:挽救事故声誉。Bitget 在 10 月 7 日时 出现了一起重大事故,有位大户卖出自己的 bgb,导致代币价格瞬间暴跌 50%,虽然后续交易所收回了所有跌幅,但是这件事严重引发了大家对交易所流动性和深度的担忧, 同时 bgb 的真实交易量,还有 bgb 价值判断, 都受到了非常大的挑战。虽然交易所后面的公关和扑救都做得很好,但我们仍然要靠事实说话, 出了事故就是说明水平不行, 大家对平台币,甚至整个交易平台的前途,自然会有很大的怀疑。 所以拉盘 BGB 也是挽救事故声誉的措施,通过不讲道理的暴富效应和铺天盖地的周密宣传冲淡大家的担心。
3, 特殊考虑:筹码结构极佳。前面说了 BGB 在某种程度上是一个单机币,也就是说大量的筹码是在交易所和相关机构自己手中的,他们可以控制卖出量。 控制了筹码拉升起来就非常容易了, 再加上明牌庄家币这个盘形不一定要在本币上盈利多少,拉出信仰和知名度也是考量之一, 做市团队就可以放开手脚往上冲。 其实这个币到的后面都可以感觉到大家是在赚市值的钱了, 但是比起信任来讲,花的这点钱可以说是微不足道了。
带大家看了一个进攻型拉盘的例子, 希望大家可以体会到一点我这种盘外招的味道。 特别声明,我这个例子没有任何批评 bitget 平台的意思,在 pizza day 当天, 推特上非常热闹,都在晒来自交易所的礼物,但只有 @Yuanzhuo_labs @TokenPocket_CN 和 @xiejiayinBitget 哥 @BitgetWalletCN 给我送了礼物, 所以站在我的立场上,无论大家对 BG 有再怎么多的批评,我还挺感谢他们的哈哈哈。同时,这场拉盘本来也是可以进入平台币操盘模型和营销学史册的一次事件。
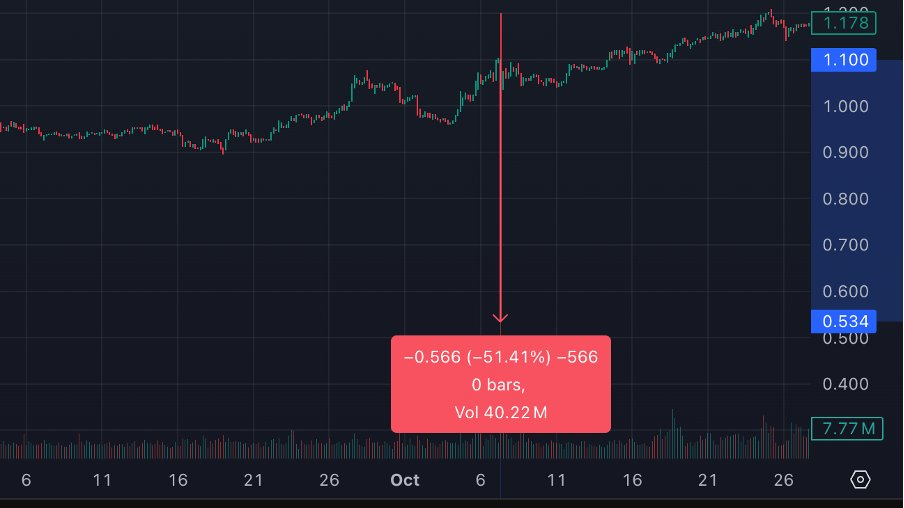
3.2 背水一战:TST
tst 是 BSC 币安链上的龙头 meme coin, 是一个在土狗热朝里跑出百倍行情的币, 同时也是我唯几吃到了的涨幅。 tst 的发展一波三折, 但最后的暴力拉盘是一个箭在弦上不得不发的情况,我们一边讲故事,一边讲逻辑。
2025 年 2 月 6 日:BNB Chain 官方发布代币创建教学视频,部署 TST 测试代币。meme 热潮情绪下社区开始炒作,误以为 TST 有「官方背书」,价格快速上涨。这个时候 tst 已经是 bsc meme 先行者了,资本市场对「第一个」的概念总有溢价,tst 地位其实已经比较重要,但是在早期的混沌阶段,无论是项目方还是市场对 tst 都没有清晰的逻辑。
2 月 7 日, @cz_binance 搞了个蜜汁操作,发帖声明 tst 与币安没有关系,让大家不要瞎几把炒作。 其实站在这一位技术男老板的角度,我是可以理解他的想法的,CZ 是一个看重真实价值的人,无论是创立 BSC 链还是他的一系列投资作风,对整个 meme 虚无主义炒作本来就不太感冒,发表这个声明也是比较经典的 NFA 避嫌。 但是大表哥忽视了一个问题,我们在 2017 年开始其实就这种习惯,大佬越是发贴否认什么, 大家就会觉得这个东西越正宗,当年很多项目就蹭 v 神的否认评论,表哥可能有点记不得那个时候的习惯了,所以 tst 在发贴避嫌暴跌 70% 之后又很妖怪的 v 上来横住, 最可怕的是对他讨论声达到顶峰。 这个时候核心拉盘逻辑就来了:
第二阶段,明牌拉盘,tst 上涨 10 倍。 我就是在这个阶段介入的,大家问为什么涨, 还记得我们第二种明牌庄家盘的模型吗?「箭在弦上不得不发」, 全网的目光都聚集在 tst 上,这个时候,它已经被定价为 BSC meme 龙头,如果币安不把这个币拉起来,那大家以后就不信币安了,相当于完全放弃土狗赛道,甚至整个链上未来。
这个时候投资逻辑就很简单了,就是赌币安团队行不行,大家要知道那个时候网上对币安骂声一片啊, 说他市场份额被严重侵蚀,又跟不上潮流,闺蜜盘乱来,还腐败,已经快寄了。但是作为老韭菜我非常相信币安, 有些信任是不需要讲逻辑的,我已经见证过无数次 @binancezh 绝境回生,不需要像一个小愤青一样赌他们这一次会认输。有这个认知加上明牌庄的盘型,我就很放心的打钱了。 后面的故事大家都知道,现在推特上币安粉一大堆, @heyibinance 一姐实力打脸所有质疑币安要垮掉的人,币安继续断层碾压各大交易所。 可是巅峰产生虚伪的拥护,坚挺的逻辑才是忠实的信徒,希望大家也可以明察秋毫,坚定投资好项目。
拉盘阶段结束后的回踩是个非常标准的旗形整理,之后就是二级阶段交给市场发挥了。
币安「用市场说话」的营销思路可谓简洁高效优雅,比起铺天盖地的孙式营销学和发动群众的 bg 营销学,盘面说话的币安营销学在我看来是难度最高,但又最直指核心的打法。
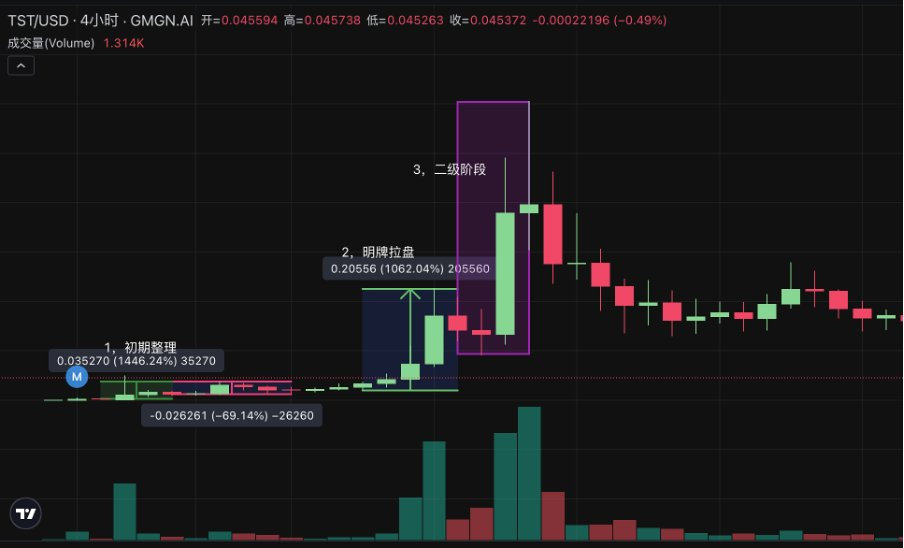
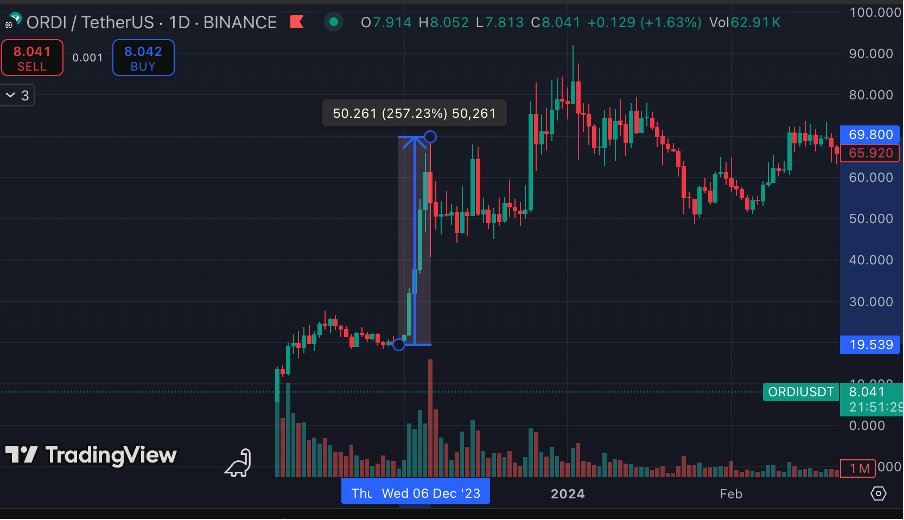
比如上面说的 TST,TST 之后 bsc 上 meme 百花齐放,币安钱包也一飞冲天, 直到今天的 alpha 打新系列也受到当时 TST 提振的影响,这就是超级经典的一个带动一窝思路。 再给大家简单地举个例子,ORDI,币安二阶段拉盘 Ordi 其实就是想告诉大家,虽然 OKX 垄断了铭文发行市场,但是真正的二级定价还是在我们这里。 这次造富行动也是非常有成效的,直到今天,币安的上币造富效应都受到当年拉盘的影响。
没想到明牌庄家盘写了这么多字, 我个人是最喜欢的是第二章讲的美式强庄盘,可能是明牌庄家盘例子里的小故事比较多吧,篇幅不短,但是大家读起来应该还挺轻松的。 接下来简单讲一讲经典的威科夫发展模式:
4,威科夫盘面模式
这一节是技术分析教学了, 要想深入学习威科夫这门技术可以读好几本书,我们这里简单讲一讲整个盘面的宏观构造。
「从 20 世纪初到现在为止,著名的金融机构所遵循的最根本的市场判断原理,很多是从道氏理论和威科夫理论中总结出来的,只是他们不出来说而己。他们更希望大众交易者使用平均线或者 MACD 等技术指标,因为他们深深知道,这些表象工具的使用者是他们利润的源泉」
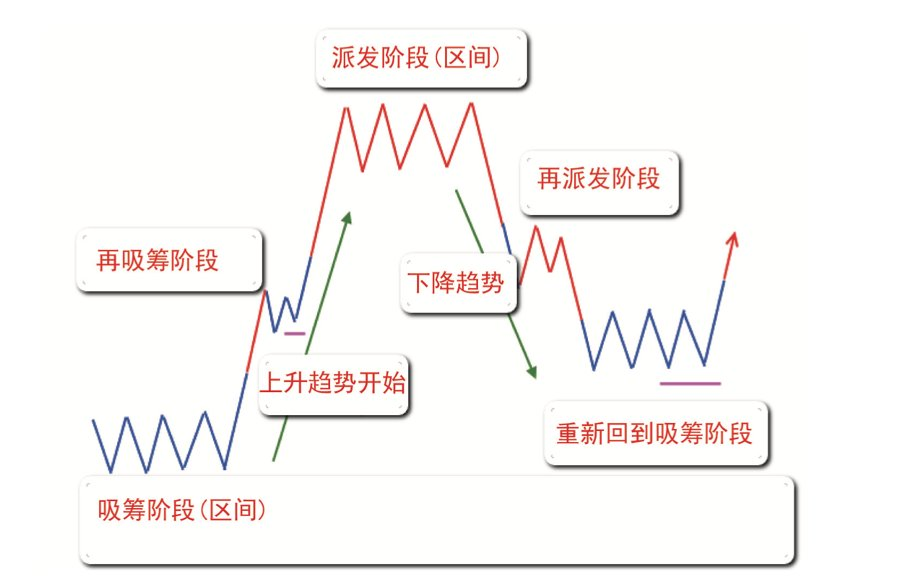
一个完整的趋势周期可以分为以下四个主要阶段:吸筹(Accumulation)、上涨(Markup)、派发(Distribution)、下跌(Markdown)。如下图所示:
-
吸筹阶段,主力在低价区域逐渐买入资产,建立仓位,价格通常处于横盘或窄幅震荡状态。
-
目标:主力悄无声息地积累足够筹码,为后续上涨做准备。
-
上涨阶段,价格突破吸筹区间,进入上升趋势,主力推动价格上涨以获利。
-
目标:主力通过推动价格上涨获利,同时吸引更多买盘入场。
-
派发阶段, 主力在高价区域逐步卖出持仓,将筹码派发给散户,价格再次进入横盘或震荡区间。
-
目标:主力完成高位出货,为下跌趋势做准备。
-
下跌阶段, 价格跌破派发区间,进入下降趋势,主力基本清仓,市场供过于求。
-
目标:价格回归低位,主力可能重新开始吸筹,形成新的周期。
以太坊 2017 轮长得比较经典,大家看个实盘吧。 我就不在图上标阶段了,看了上面的分析大家可以自己找一下每个区间对应哪个阶段。
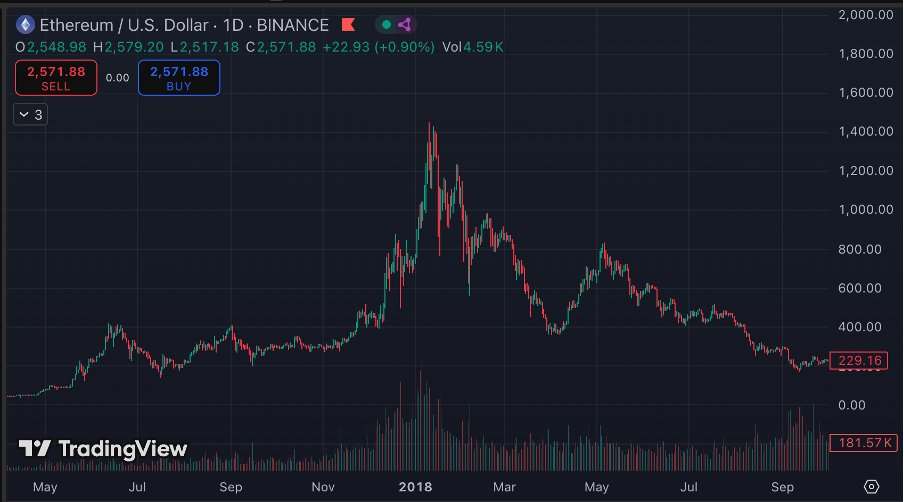
需要注意的是,第一,实际操盘当中,威科夫形态的变体非常非常多,完完整整科书般的走势可以说几乎没有,还是所谓学我者生,似我者死。掌握逻辑后变通是最重要的。 第二,主力也知道这一套分析方法,所以实际交易当中主力骗线非常吓人,假动作很多。这个是绝知此事要躬行的,只能在实战中积累经验。最后,NFA, Dyor。
5,杂盘漫谈
上面总结了几种经典的发展模型, 我人力所能及的经验和千变万化的市场相比,简直可以说是微不足道了,最后漫谈一些还可能存在规律的盘面,我不太掌握,但是也分享出来供大家参考。所谓有规律,就是背后有一个逻辑支撑,是按照原理运行的,这种盘面走势才和我们有关, 纯粹散户交易或者 PVP,我觉得还是没有金刚钻就别揽瓷器活了,高手请随意,欢迎讨论。
5.1 洗 qian 盘
灰色产业 规模之庞大,盈利之丰厚,远超我的想象,可以说是震惊了。 币圈涉及到洗 q 的盘面往往涨幅惊人, 有两个类别大家可以自行研究一下
-
第一种是黑市货币,比如 2013 年的比特币,现在的门罗 XMR,Hype,Trx。 这些用于黑市结算或者对敲交易非常方便的公链货币,在后比特币时代是大有潜力的,我最近也在研究他们,之后可能出一篇文章小聊一下。
-
第二类就是洗钱盘本身,比如一天涨了 5 倍的 Bome, 还有许多黑客喜欢把资金换成 eth,他们可能在以太坊上面找土狗对敲出去, 链上的蛛丝马迹我不是很熟,但是可能也有一些抓手。
5.2 VC 币
VC 币是很好的做空对象, 先聊一下为什么币安上币后老是跌,几乎成了一个雷打不动的送钱交易机会,本质原因主要在于筹码结构太松散,上币前又是空投又是 launch pad 发了很多币到散户手里,刚上后庄家自然没有理由帮散户抬轿,大家互相抛售就造成下跌。
在这种盘面里的 VC 币又是更严重的,由于 VC 手里有大量的未流通代币, 他们又急着出货,同时 VC 币常常有估值过分高的坏习惯,导致很难找到承接的新庄家, 所以一些低质量的 VC 币做空起来是很不错的选择。
5.3 亚系庄家盘
亚系庄家盘和美式庄家盘的逻辑几乎一样,但是有这类代币,他们起落速度往往非常快, 甚至在我看来是过于生猛了,可能在三天内走完美式庄家盘两个月的走势。 同时非常非常巧合的是,这类代币的项目方,或者做市团队,或者机构,往往是亚洲的。比如说国人币,我就给他取了个鬼名字叫亚系庄家盘了,比如说 Trump 和米莱币, 一个是北美庄家操盘,一个是亚洲庄家操盘,甚至有传闻说阿根廷总统米莱币是个深圳集团发的,那个格局和镰刀速度就截然不同了。
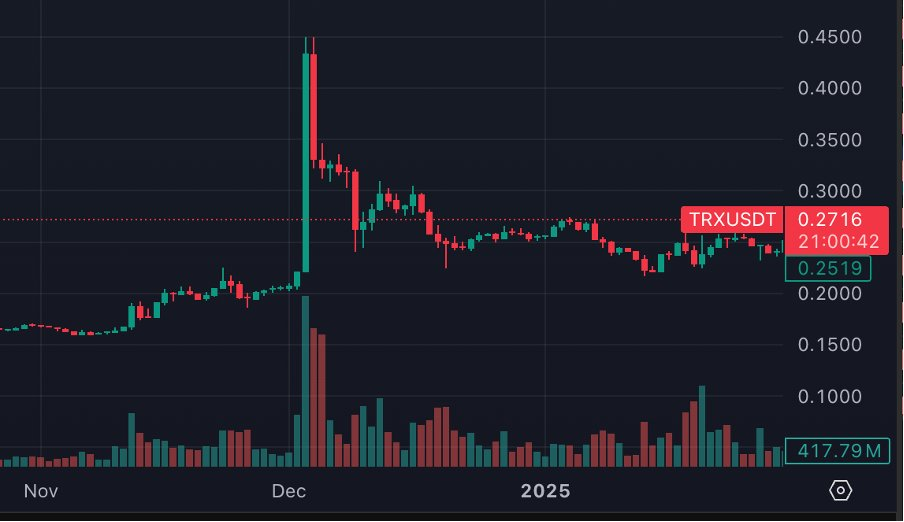
比如说, TRX,大家按我第二张说的美式拉盘逻辑去看一下,其实每个阶段大概是能对上的,但就是速度太快了, 合理怀疑操盘手是几个生猛 00 后,我这种炒币走心的 04 后,已经干不过人家炒币走肾的年轻人了。 这种快餐式的行情里真的是要渣男不要暖男,要走肾不要走心。
唉咱们亚洲人啥时候能持久点啊,学学老美,太快了没反应过来就结束了。
二级盘面类型还有很多,今天就聊这么多了,欢迎大家评论区讨论。
结语
孙子兵法《虚实篇》:「兵无常势,水无常形。」 盘子兵法这篇文章写了将近万字, 最主要还是想和大家交流逻辑与经验, 但是当然,咱们做一个盘面发展模式上的总结,对日后的二级交易会有帮助,实在不行把这篇文章当作小抄一样对着看, 也好过没有章法的赌博。可是做为一个交易者,还是要提醒大家不能按图索骥,更不能纸上谈兵,很多知识是实战当中体会出来的。
市场如战场
最后用一首毛主席的诗结尾吧,
「读六月三十日《人民日报》,余江县消灭了血吸虫。浮想联翩,夜不能寐。微风拂煦,旭日临窗,遥望南天,欣然命笔。
绿水青山枉自多,华佗无奈小虫何!
千村薜荔人遗矢,万户萧疏鬼唱歌。
坐地日行八万里,巡天遥看一千河。
牛郎欲问瘟神事,一样悲欢逐逝波。」
免责声明:本文章仅代表作者个人观点,不代表本平台的立场和观点。本文章仅供信息分享,不构成对任何人的任何投资建议。用户与作者之间的任何争议,与本平台无关。如网页中刊载的文章或图片涉及侵权,请提供相关的权利证明和身份证明发送邮件到support@aicoin.com,本平台相关工作人员将会进行核查。


