币圈资讯
6月7日热点;
1.美众议院议长约翰逊:税改法案一定会通过,不要挑战特朗普
2.加密倡导团体呼吁驳回对比特币混币服务 Samourai 的案件
3.德意志银行评估稳定币与代币化存款应用,推进支付与托管布局
4.Pumpfun 拟将部分协议收入分配给未来的 PUMP 代币持有者
5.WLFI 与 TRUMP Meme Coin 达成合作,并计划将 TRUMP 纳入长期储备资产组合
交易心得
很多散户喜欢做短线交易,今天给大家分享几个短线交易的方法和技巧,让你更好的把握交易节奏! 1、盘整应对高位盘整后往往有新高,低位盘整后通常会出新低。操作上,别盲目进场,等变盘方向清晰后再行动,规避不确定风险。2、横盘策略横盘阶段建议不交易,多数投资者亏钱,就因难做到这点。此时应保持观望,等趋势明确后再操作。3、涨跌反弹关联下跌趋势放缓,反弹力度也弱;下跌加速,反弹往往也迅猛。可依据下跌的速度与幅度,判断反弹强度,灵活做交易决策。4、建仓方法采用金字塔式建仓,这是价值投资核心理念之一。分批买入,既能降低持仓成本,又能分散投资风险 。5、持续涨跌后操作持续涨跌后必然进入横盘。这时,高位不用急着卖,低位也别急着买,等变盘信号出现,再择机行动。 交易核心在于保持稳健与耐心,避免情绪化操作。市场从不缺机会,缺的是等待机会的耐心,以及抓住机会的能力,做到这些,才能在投资市场长期存活并盈利!
LIFE IS LIKE
A JOURNEY ▲
下方是大白社区本周实盘群单子,恭喜跟上的币友,如果你操作不顺,可以来试试水。
数据真实,每一单都有当时发出的截图。
搜索公众号:大白论币
BTC
分析
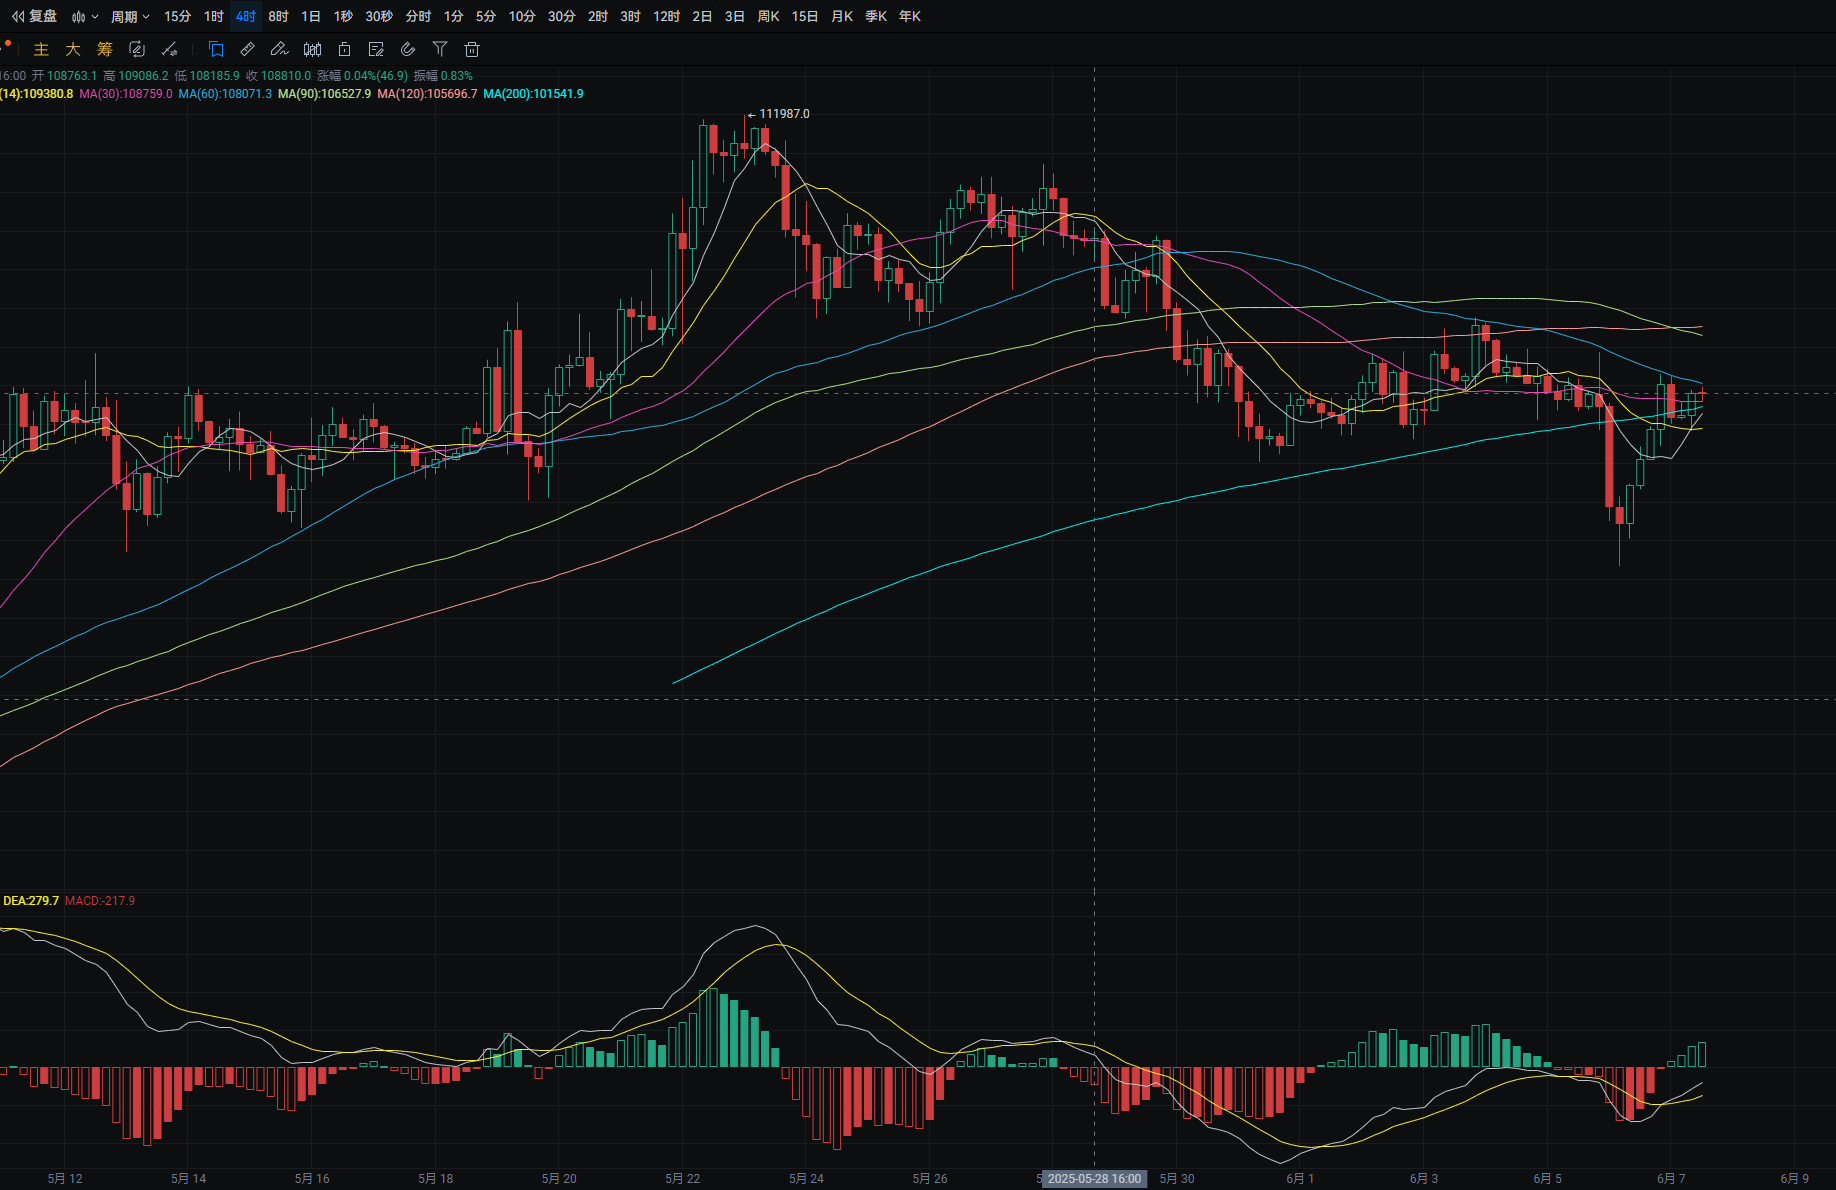
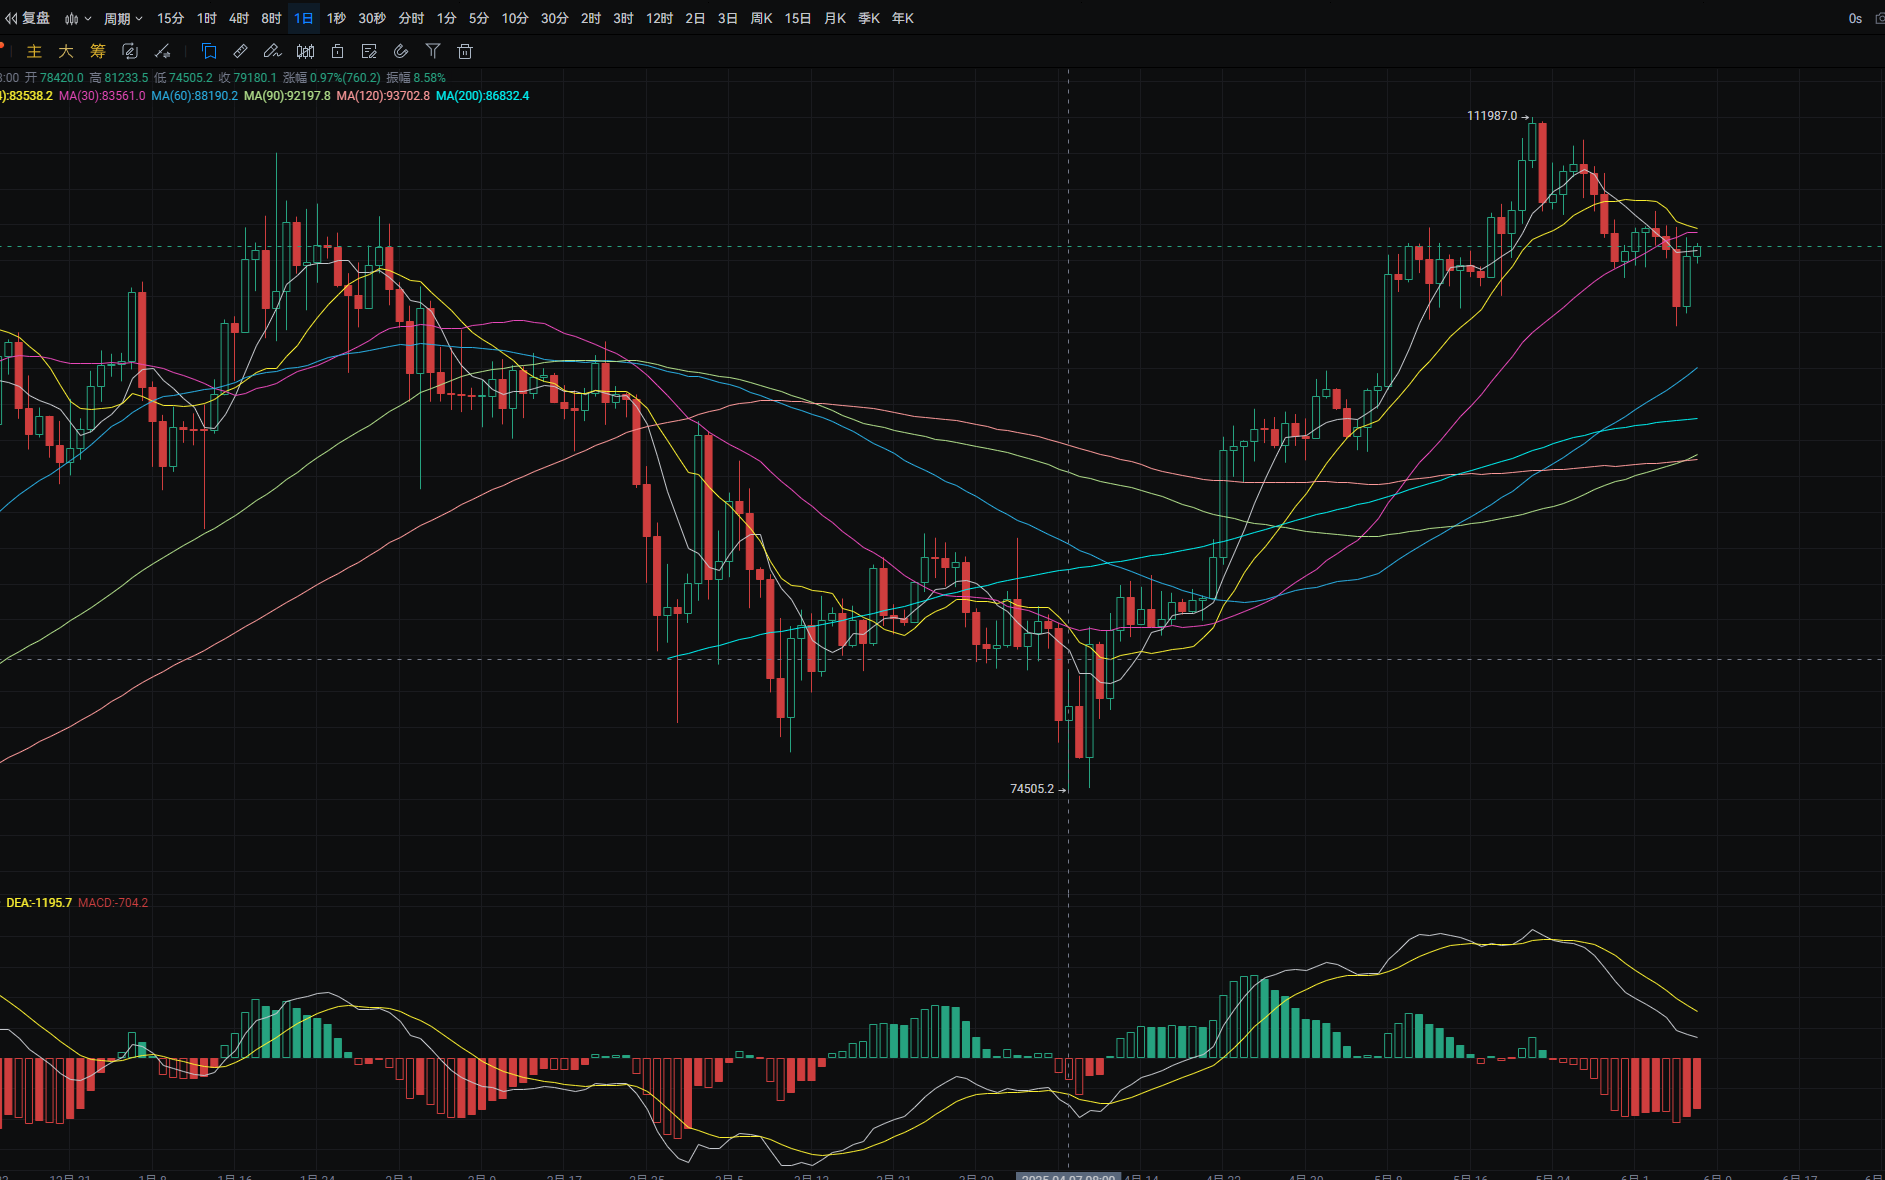
大饼日线昨日从最低101050附近上涨至最高105300附近 收线在104250附近 下方支撑位于103600附近 跌破则可看至102650附近 回踩可在附近进行接多 上方压力位于MA30附近 突破则可看至107250附近 反弹至附近可进行接空 MACD空头缩量 四小时下方支撑位于MA14附近 跌破则可看至102700附近 回踩可在附近进行接多 上方压力位于105800附近 突破则可看至MA90附近 反弹至附近可进行接空 MACD多头增量 形成金叉
ETH
分析
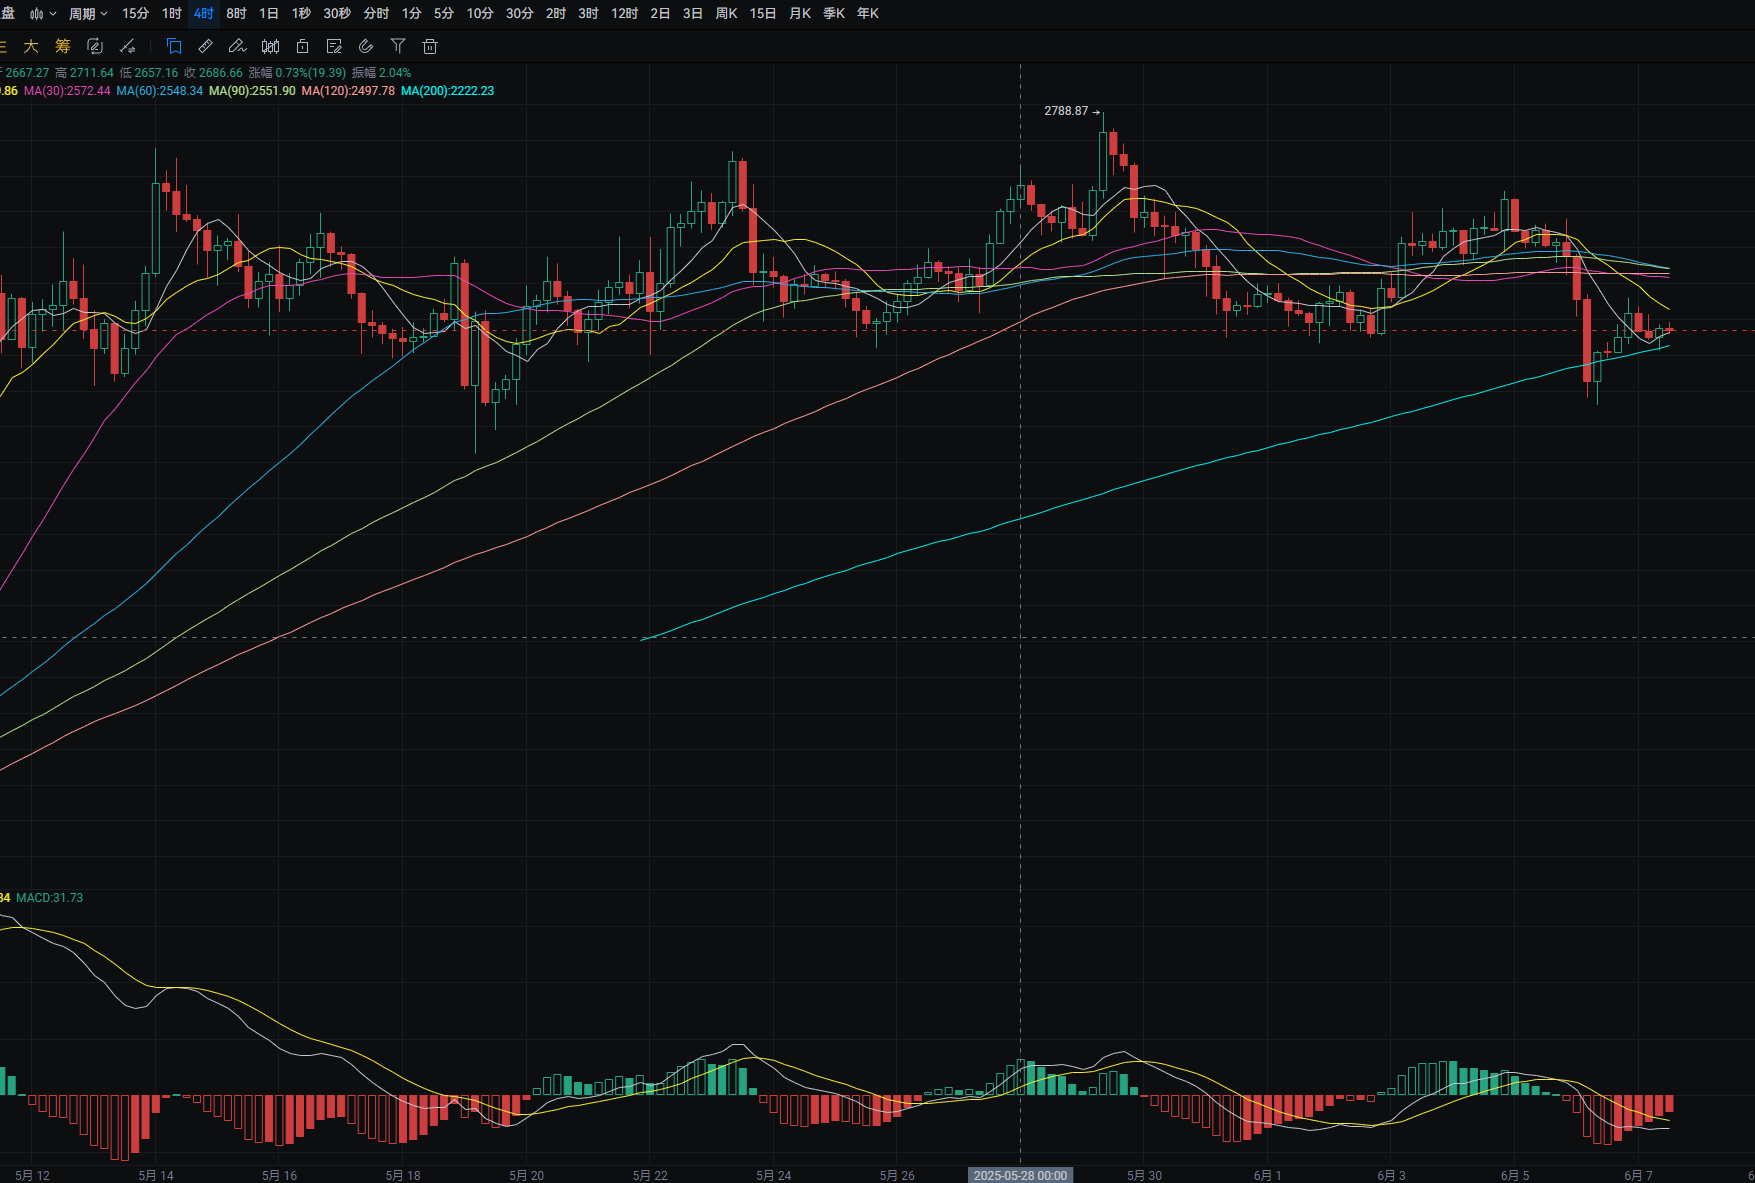
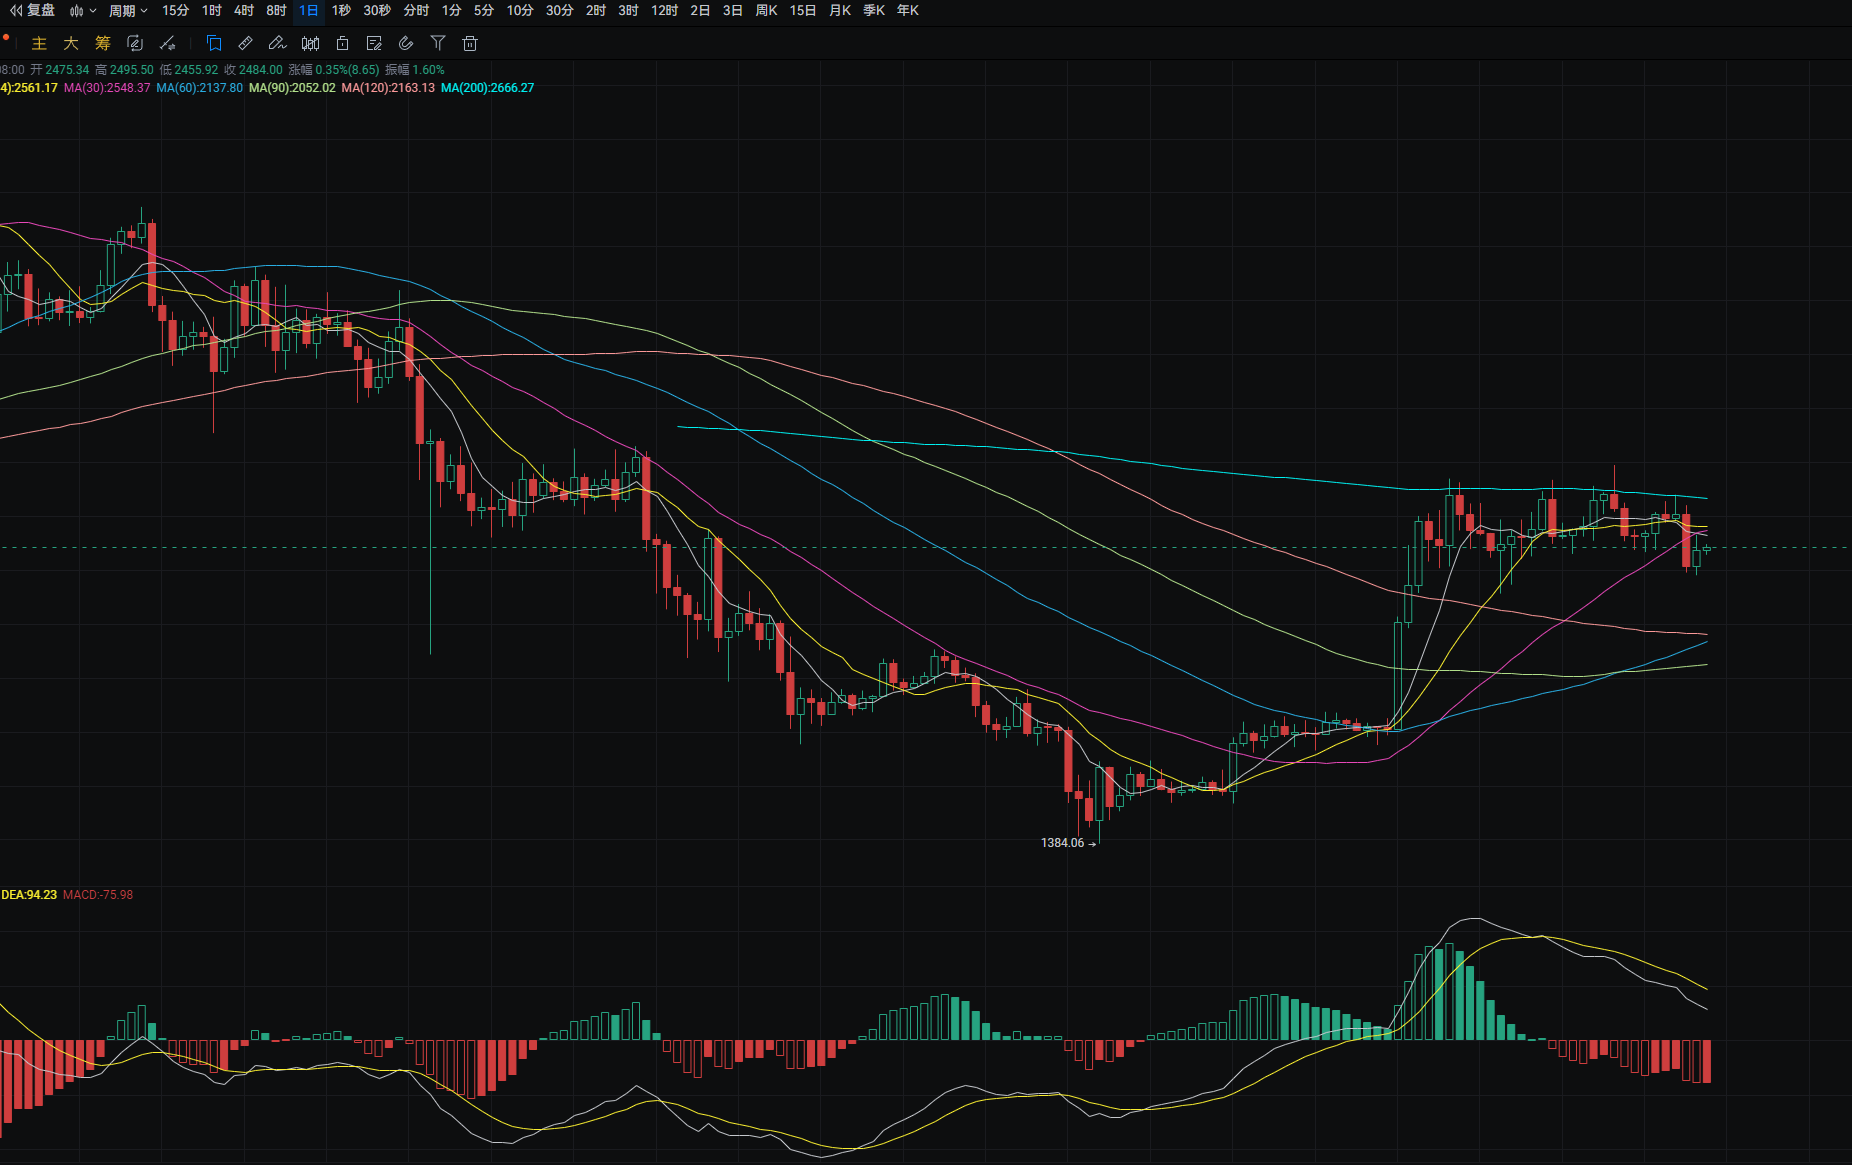
以太日线昨日从最低2380附近上涨至最高2530附近 收线在2475附近 下方支撑位于2450附近 跌破则可看至2420附近 回踩可在附近进行接多 上方压力位于MA30附近 突破则可看至MA200附近 反弹至附近可进行接空 MACD空头增量 四小时下方支撑位于MA200附近 跌破则可看至2390附近 回踩可在附近进行接多 上方压力位于MA14附近 突破则可看至MA30附近 MACD空头缩量 有形成金叉的迹象
免责声明:以上内容均为个人观点,仅供参考!不构成具体操作建议,也不负法律责任。市场行情瞬息万变,文章具有一定滞后性,如果有什么不懂的地方,欢迎咨询
免责声明:本文章仅代表作者个人观点,不代表本平台的立场和观点。本文章仅供信息分享,不构成对任何人的任何投资建议。用户与作者之间的任何争议,与本平台无关。如网页中刊载的文章或图片涉及侵权,请提供相关的权利证明和身份证明发送邮件到support@aicoin.com,本平台相关工作人员将会进行核查。


