周彦灵:5.24比特币 以太今日最新走势预测分析及操作策略
昨晚的这波回调就是个回落调整姿态,要说趋势反转还为时过早,况且这波回撤幅度不过5000点而已。在这种情况下,现在要确定的就是形态,目前币价从突破底部三角整理结构,和实现高位111900的趋势水平破位后,衍生的延续上涨表现,但是它并非是独立式暴涨行为,而是反复震荡,一共有两段,且这两段角度雷同,属性雷同,幅度雷同,所以你能明白为什么110000能作为反跌价格的关键分水岭了吧?这波已经回吐了延续涨幅,且没有受到阻碍直线下降,那么接下来咱们需要做的就是静待时机,准备再次低位接多单入场即可了。
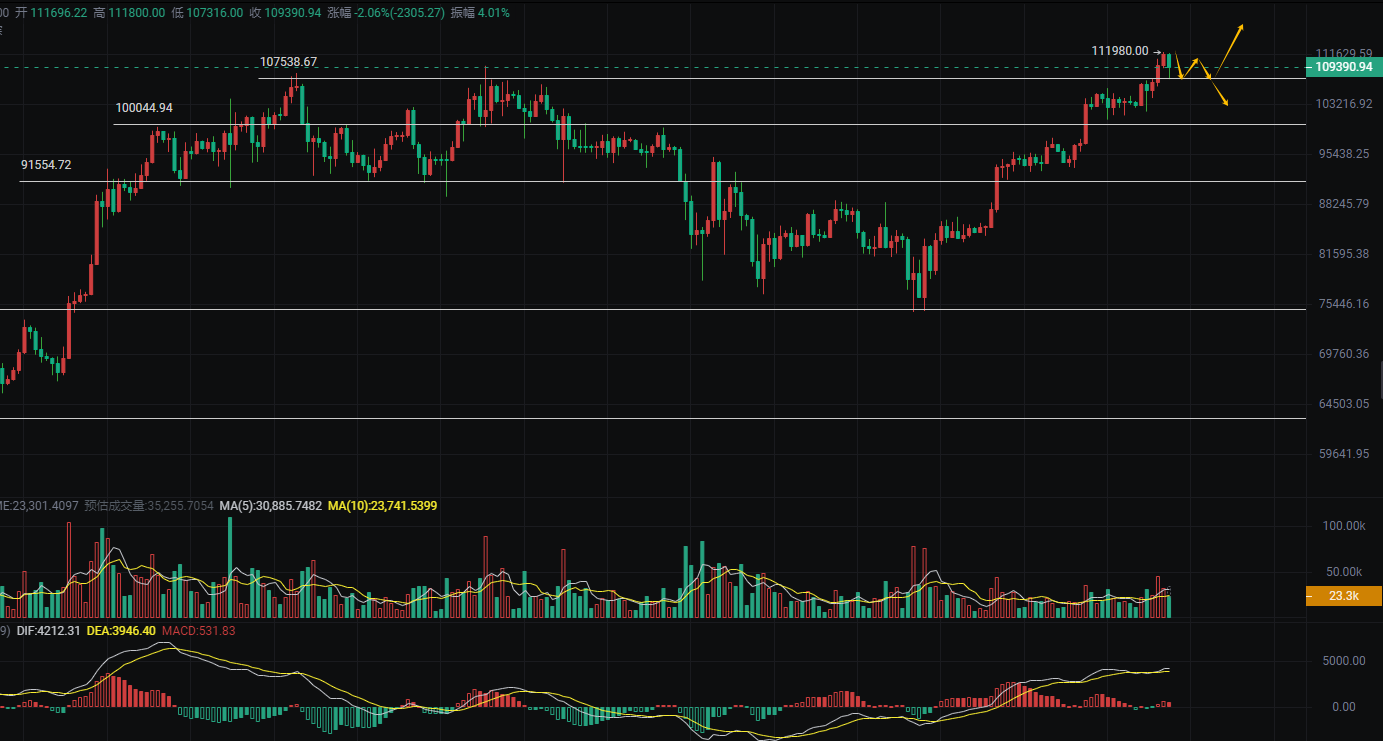
技术面来看, 比特币价格目前在4小时图上略低于50周期简单移动平均线(SMA 50),这是一个短期看跌信号。且同样低于200周期简单移动平均线(SMA 200),表明短期内市场处于看跌状态,存在进一步回调的可能性;4小时图RSI目前约为55.12,处于中性区域,表明市场既非超买也非超卖。RSI未进入超买区域(>70),因此短期内没有明显的顶部信号, 如果RSI跌至60以下并出现反转信号,则预示短期底部形成,届时可寻找适合的低位多单布局机会;小时周期MACD处于负值区域,且快慢线逐渐靠近零轴,显示出卖方力量减弱,短期内可能迎来反弹。币价目前在EMA7之上但低于EMA30和EMA120,显示未来大趋势依然偏强。
周彦灵5.24大饼操作策略:
1、107800-108600多,止损106800下方,目标110000-111000
2、111400-110600空,止损112400上方,目标109500-108700
周彦灵5.24以太操作策略:
1、2470-2510多,止损2430下方,目标2570-2615-2650
2、2650-2600空,止损2700上方,目标2540-2500
【以上分析及策略仅供参考 风险请自担,文章审核发布或有滞后策略不具备及时性,具体操作以彦灵实时策略为准】

本文内容由资深分析师周彦灵(公众号:周彦灵)独家原创分享,笔者从事金融市场投资研究十年有余,目前主要分析指导BTC、ETH、DOT、DOGE、LTC、FIL、EOS、XRP、BCH、ETC、BSV等币圈合约/现货操作,如需了解更多实时社群指导、解套咨询、看盘技巧学习等可以关.注老师公众号:周彦灵 找.到老师
免责声明:本文章仅代表作者个人观点,不代表本平台的立场和观点。本文章仅供信息分享,不构成对任何人的任何投资建议。用户与作者之间的任何争议,与本平台无关。如网页中刊载的文章或图片涉及侵权,请提供相关的权利证明和身份证明发送邮件到support@aicoin.com,本平台相关工作人员将会进行核查。


