Bitcoin Price Watch: $2.21 Trillion Market Cap Fuels Momentum

CN
1 hour ago

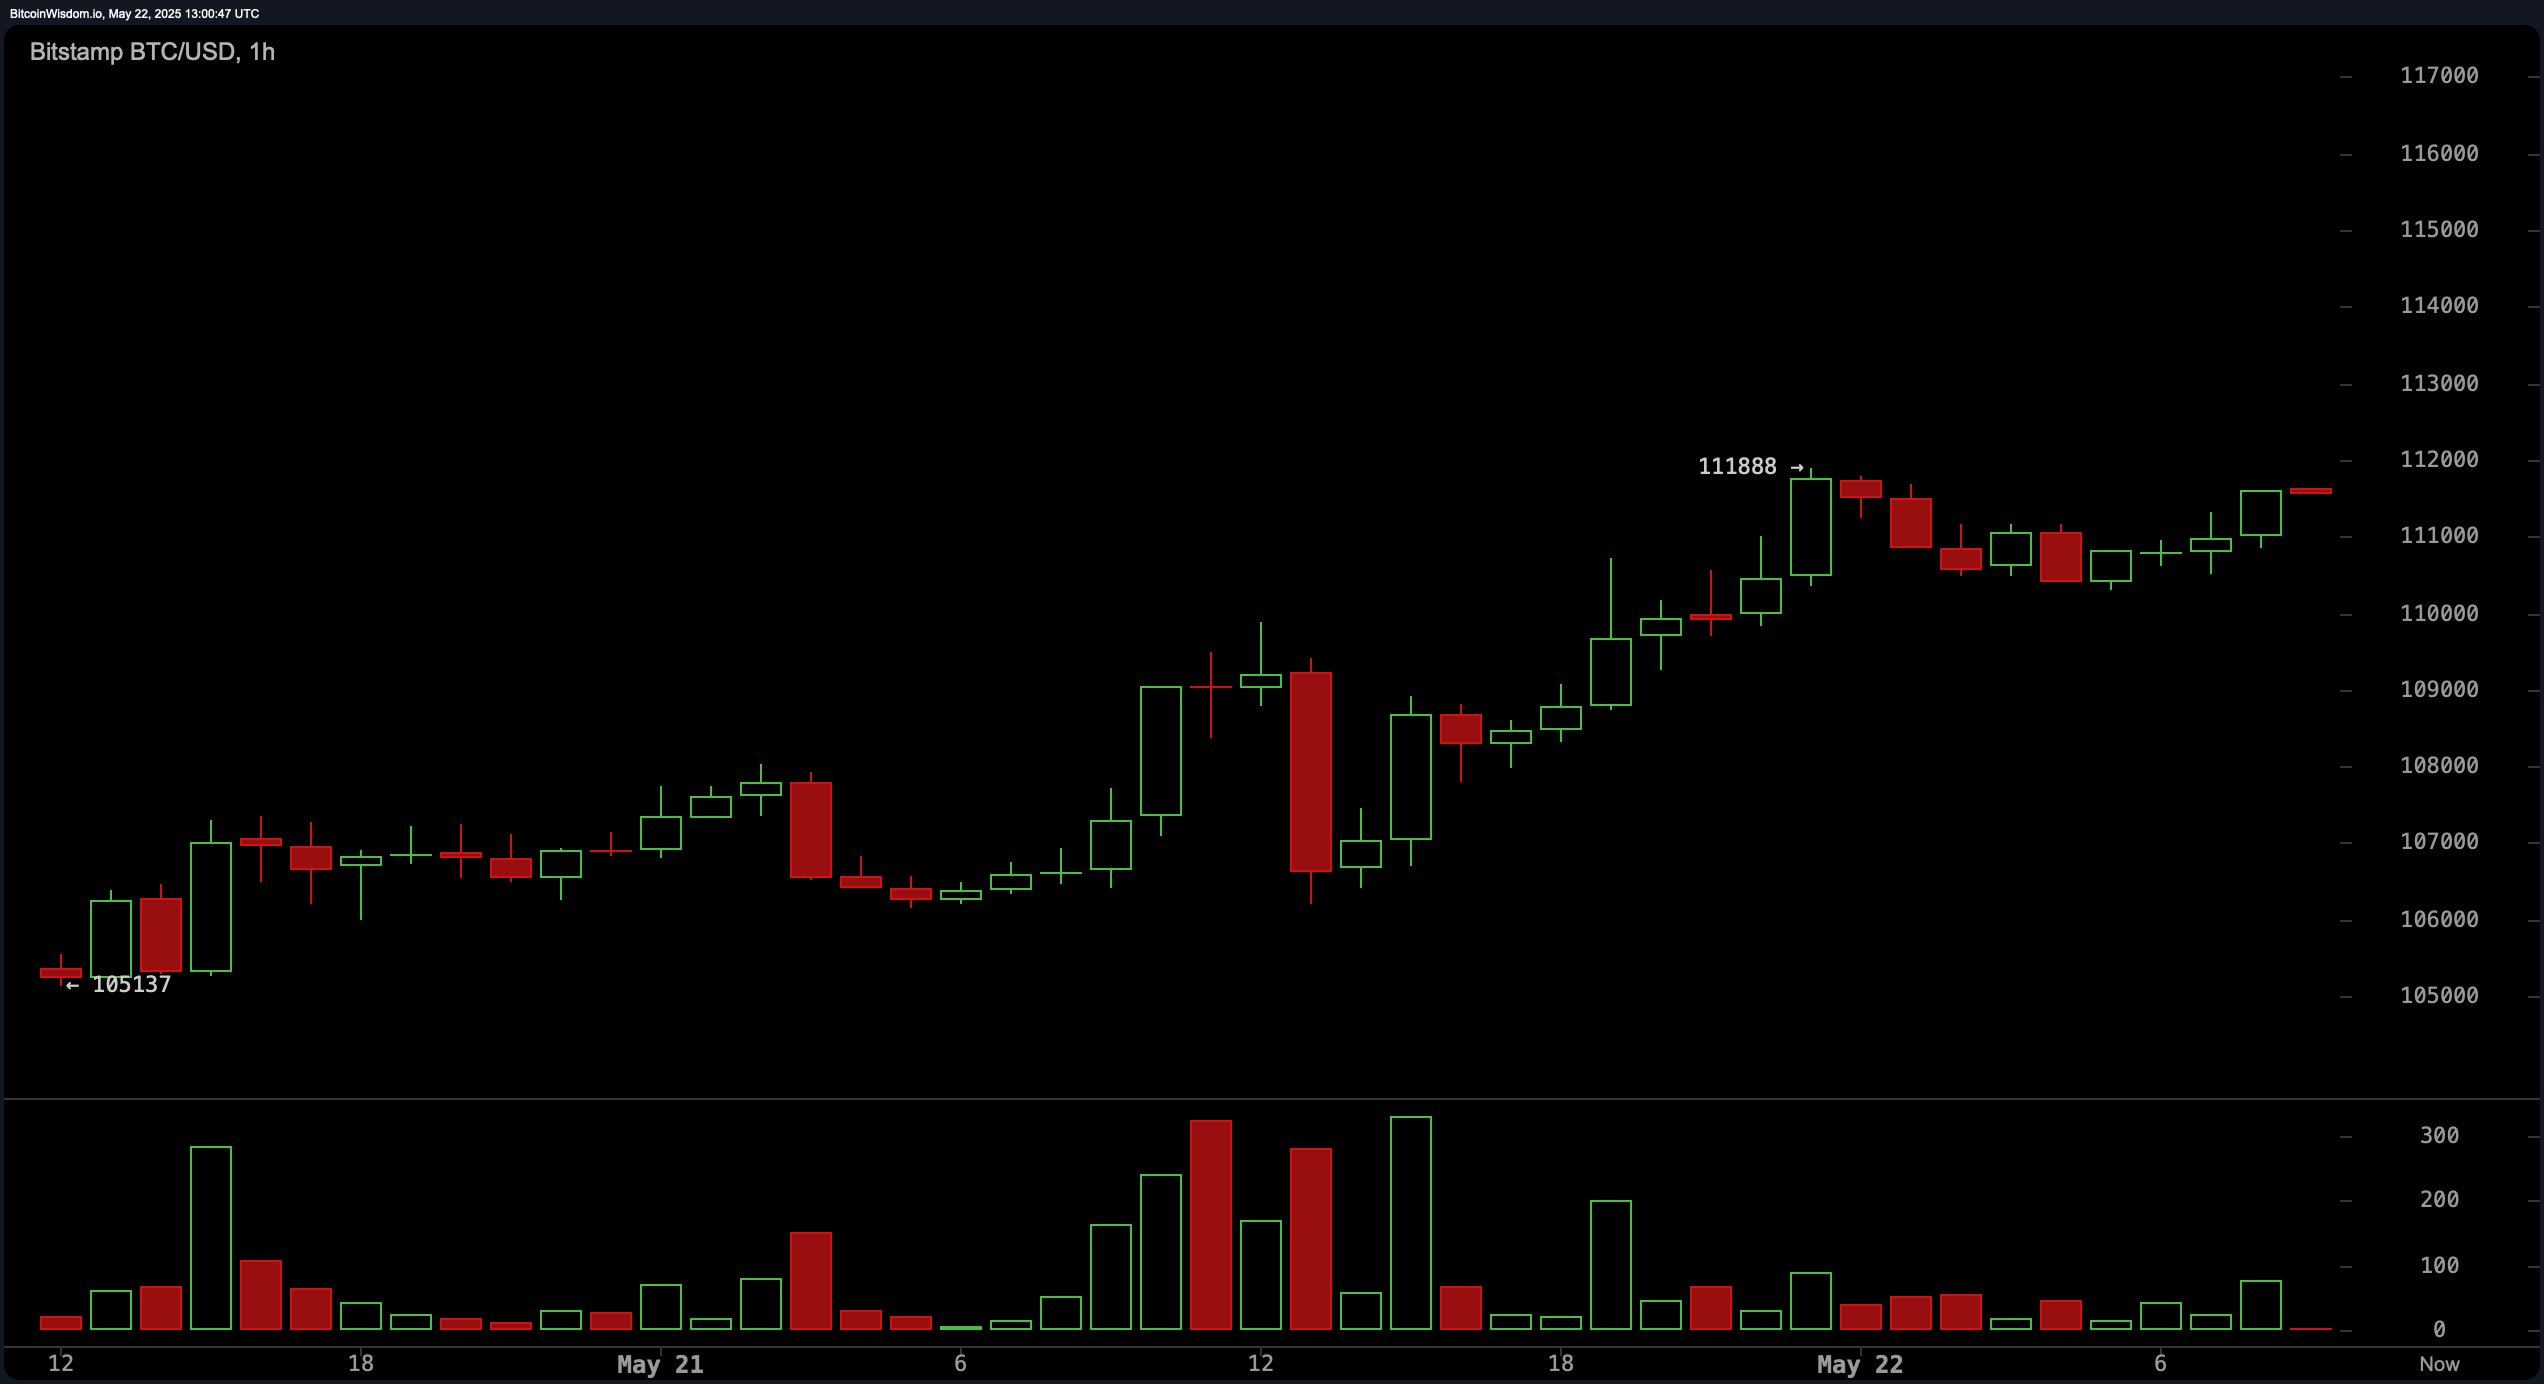
On the 1-hour chart, bitcoin maintained a series of higher lows despite choppy structure, with price peaking at $111,888 before encountering intraday resistance. The volume on recent hourly candles has declined, suggesting momentum could be softening in the short term. Bearish red candles post-peak also reinforce the view of a short-term ceiling forming near that level. Scalpers are eyeing entries near $110,000 with tight stop-losses below $109,800, while a failure to reclaim $111,800 on weak volume may prompt short positions. Profit-taking zones for scalpers are identified between $111,800 and $112,500.

Bitcoin Price Watch: $2.21 Trillion Market Cap Fuels Momentum

BTC/USD 1-hour chart via Bitstamp on May 22, 2025.

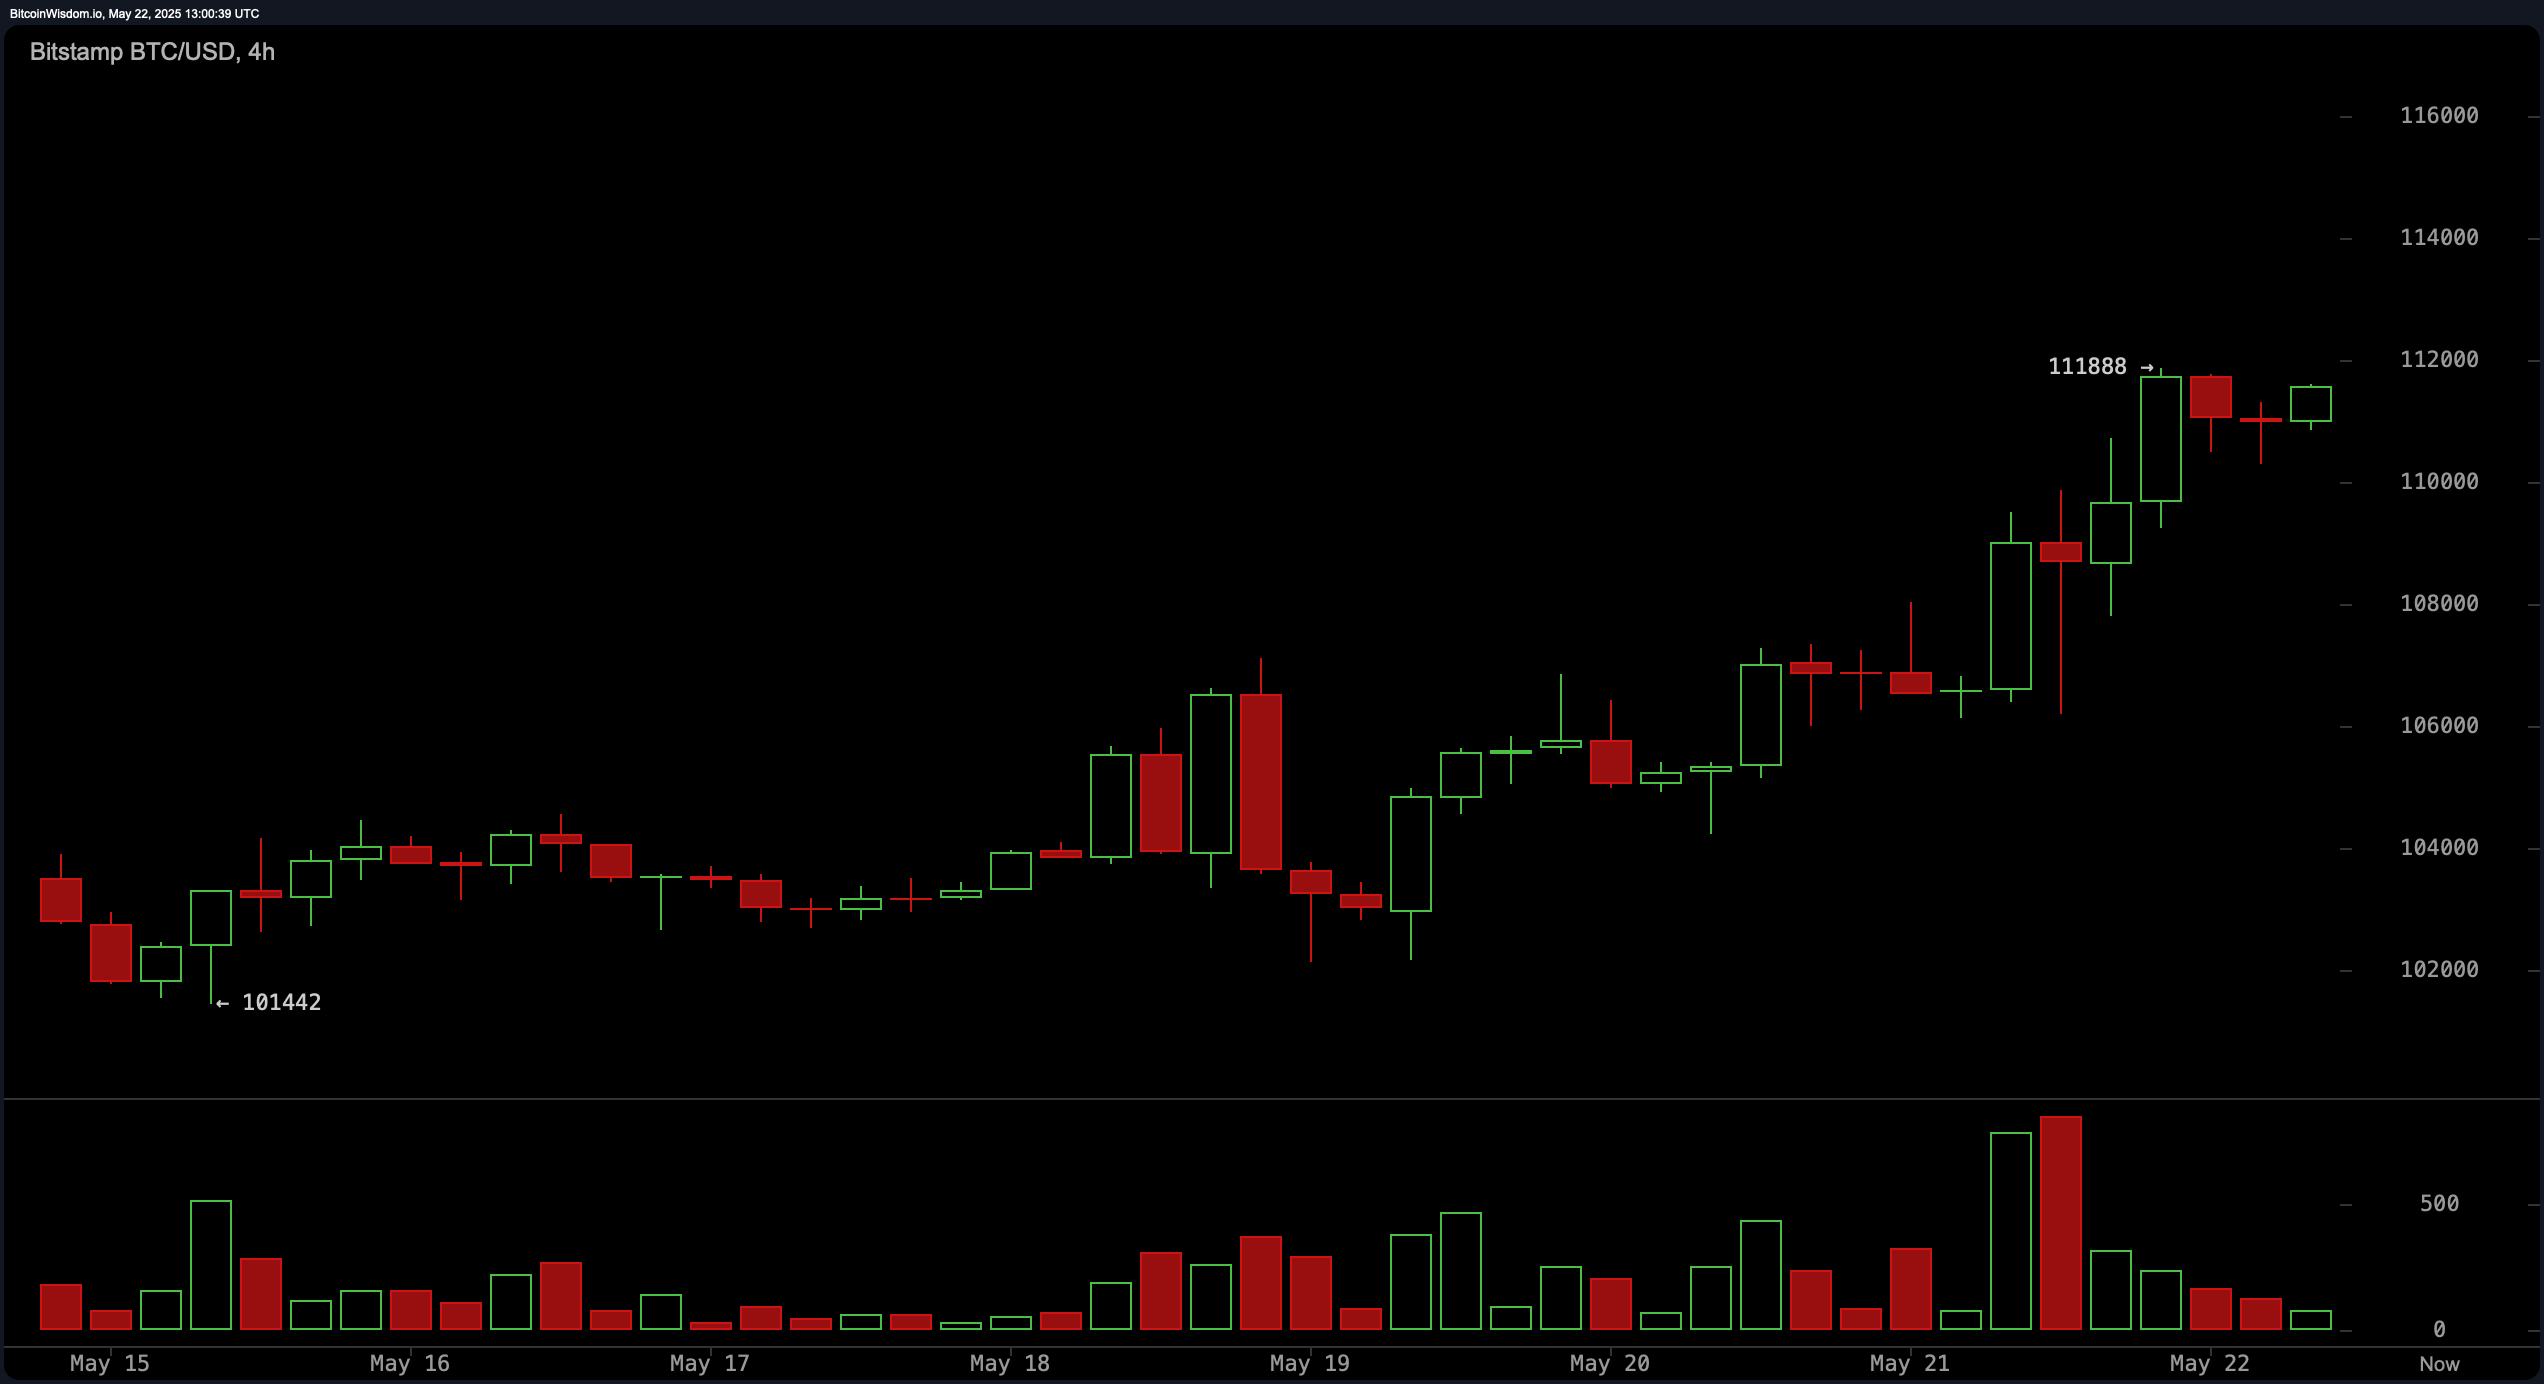
From the 4-hour perspective, bitcoin’s structure confirms an uptrend following a successful breakout above the $108,000 resistance. The subsequent pullback to the $107,500–$108,500 range held firm and resulted in a bounce, underpinned by a healthy volume spike on the breakout followed by a low-volume retrace—often indicative of sustained bullish interest. Entry levels are targeted around $109,000 to $110,000 for a potential continuation move, with conservative longs waiting for a confirmed move above $112,000. Traders should watch for early signs of bearish divergence or candlestick reversal formations near resistance levels.

Bitcoin Price Watch: $2.21 Trillion Market Cap Fuels Momentum

BTC/USD 4-hour chart via Bitstamp on May 22, 2025.

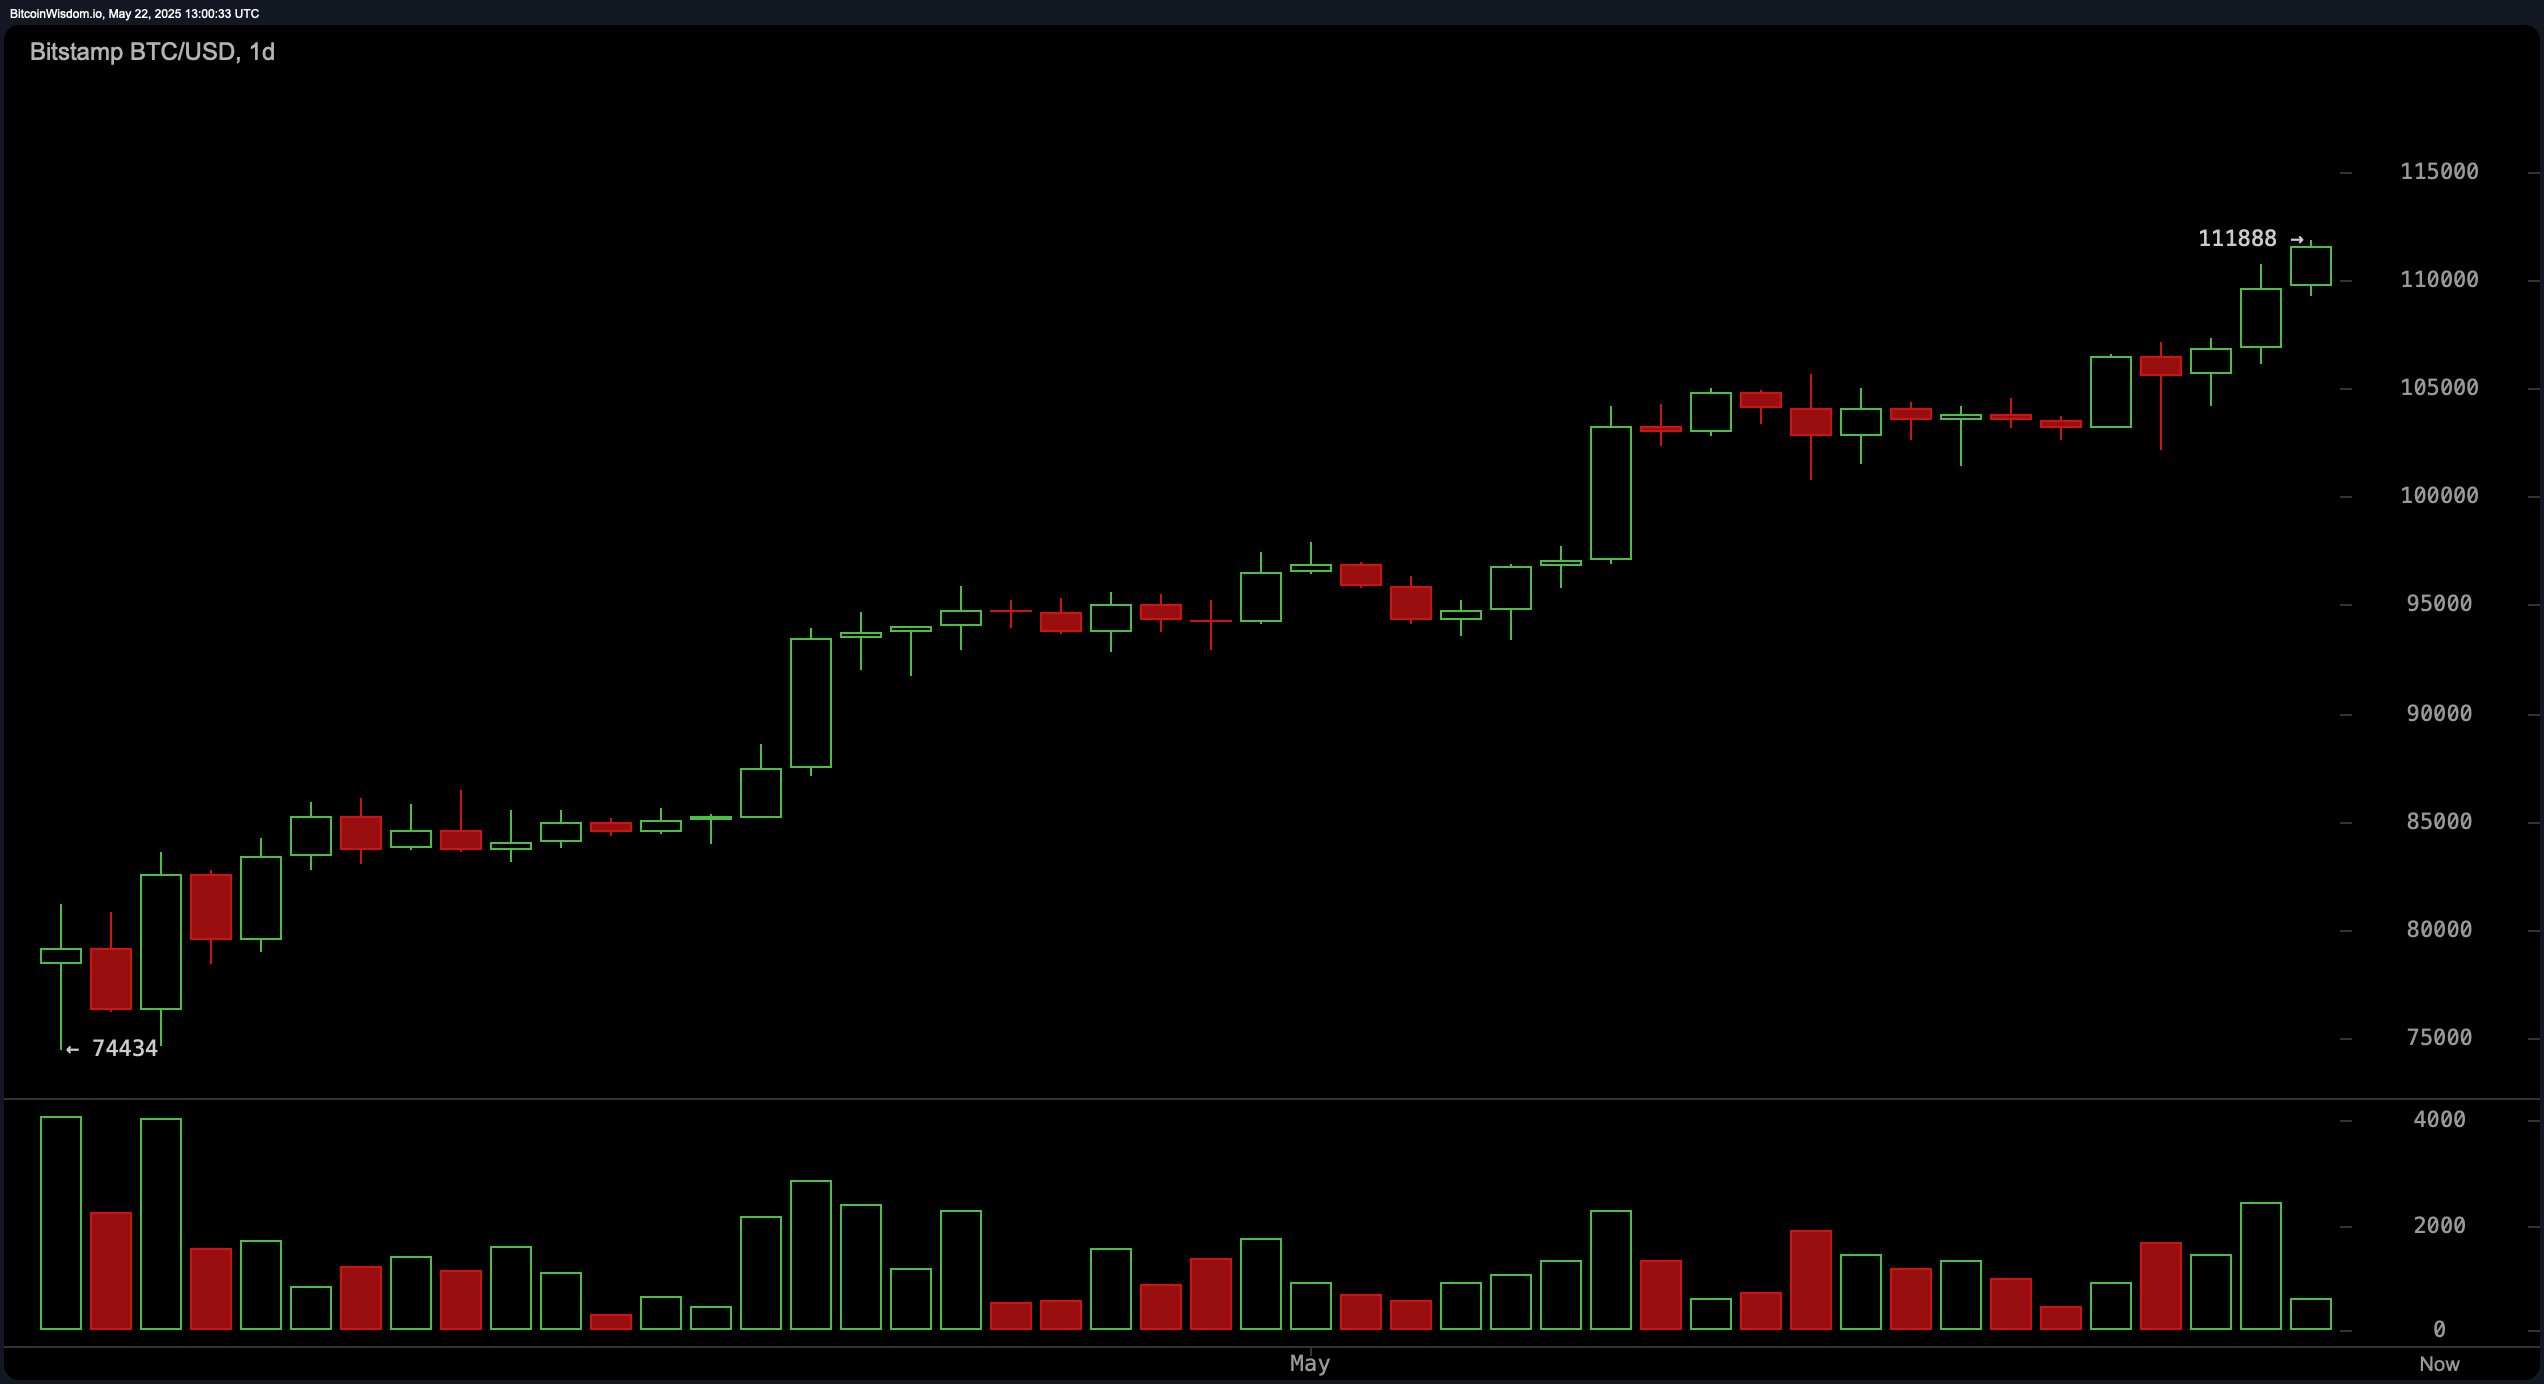
The daily chart further validates the bullish trend, with bitcoin forming consistent higher highs and higher lows. Recent price action has been characterized by strong green candles, emerging from a period of consolidation. The intraday high at $111,888 could serve as a psychological resistance level and profit-taking zone. A strategic buying opportunity may present itself if price retraces to the $105,000–$107,000 range, particularly if supported by a bullish engulfing or hammer candlestick pattern. Exit targets are established just above the historical high, in the $111,888 to $113,000 band, though traders are advised to trail stops to capture extended moves.

Bitcoin Price Watch: $2.21 Trillion Market Cap Fuels Momentum

BTC/USD 1-day chart via Bitstamp on May 22, 2025.

Momentum indicators broadly align with bullish sentiment. The momentum oscillator signals a bullish sentiment, while the MACD also reflects positive crossover dynamics. All tracked moving averages, including the exponential moving average (EMA) and simple moving average (SMA) across short-, mid-, and long-term timeframes, are issuing optomistic signals. Notably, the 10-day EMA and SMA values at $106,369 and $105,839 respectively suggest strong support just below the current price action, reinforcing the uptrend.

Despite elevated values in key oscillators such as the relative strength index (RSI) at 78 and Stochastic at 95, both of which suggest overbought conditions, their neutral rating implies that while the asset is extended, it hasn’t triggered reversal alarms yet. This combination of rising support levels, constructive volume behavior, and bullish indicator alignment underscores a market leaning toward continuation rather than immediate correction. Nonetheless, vigilance is required near resistance highs, particularly if volume fails to confirm upward thrusts.

Bull Verdict:

Bitcoin’s alignment of higher lows, consistent support from all major moving averages, and bullish confirmation from momentum indicators such as the momentum and the MACD supports a continuation of the uptrend. The successful breakout retests on lower timeframes and volume dynamics further reinforce the bullish structure. A sustained move above the psychological barrier of $111,888 could signal a new phase of price discovery.

Bear Verdict:

While the broader trend remains bullish, caution is warranted as several oscillators, including the relative strength index (RSI) and Stochastic, hover near overbought levels with neutral action. Declining volume on shorter timeframes and rejection at $111,888 indicate potential exhaustion. Failure to reclaim this high on strengthening volume could result in a short-term pullback toward support levels around $107,000 or lower.

免责声明:本文章仅代表作者个人观点,不代表本平台的立场和观点。本文章仅供信息分享,不构成对任何人的任何投资建议。用户与作者之间的任何争议,与本平台无关。如网页中刊载的文章或图片涉及侵权,请提供相关的权利证明和身份证明发送邮件到support@aicoin.com,本平台相关工作人员将会进行核查。

注册返10%、领$600,前100名赠送PRO会员
链接:https://accounts.suitechsui.blue/zh-CN/register?ref=FRV6ZPAF&return_to=aHR0cHM6Ly93d3cuc3VpdGVjaHN1aS5hY2FkZW15L3poLUNOL2pvaW4_cmVmPUZSVjZaUEFG
Ad
Share To
APP

X

Telegram

Facebook

Reddit

CopyLink