这个问题非常的好,我也一直在琢磨这个事情,所以我个人从2025年开始已经从数据的加法变为了数据的减法,不再去看更复杂更不可测的数据,而更多的是看能影响市场和情绪的事件,而通过事件来判断哪些数据可能影响力会更大,比如说 关税,实际上从开始到现在 关税 的数据几乎是没有任何的参考意义。
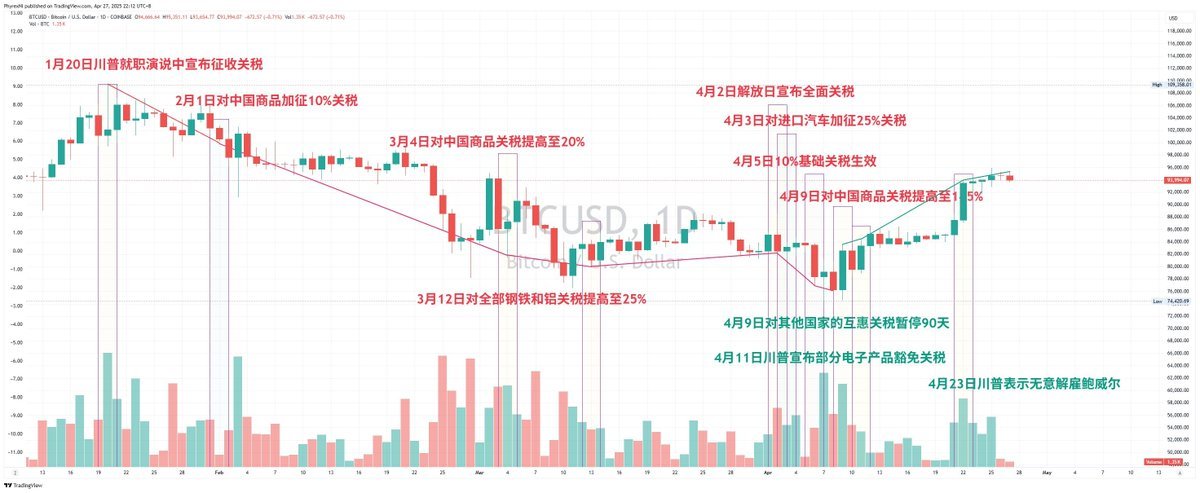
但关税的数据又是让市场不停的去指定投资方案的标杆,比如这张图,就清楚的标记了 BTC 的价格和关税的关系,如果是换成美股的价格也是一样的,都是受到了关税和情绪的影响。
说人话就是,数据是量化后的投资者情绪,但毕竟情绪是难以琢磨和预期的,所以只能是从大方向上找可能会对情绪影响更多的数据。
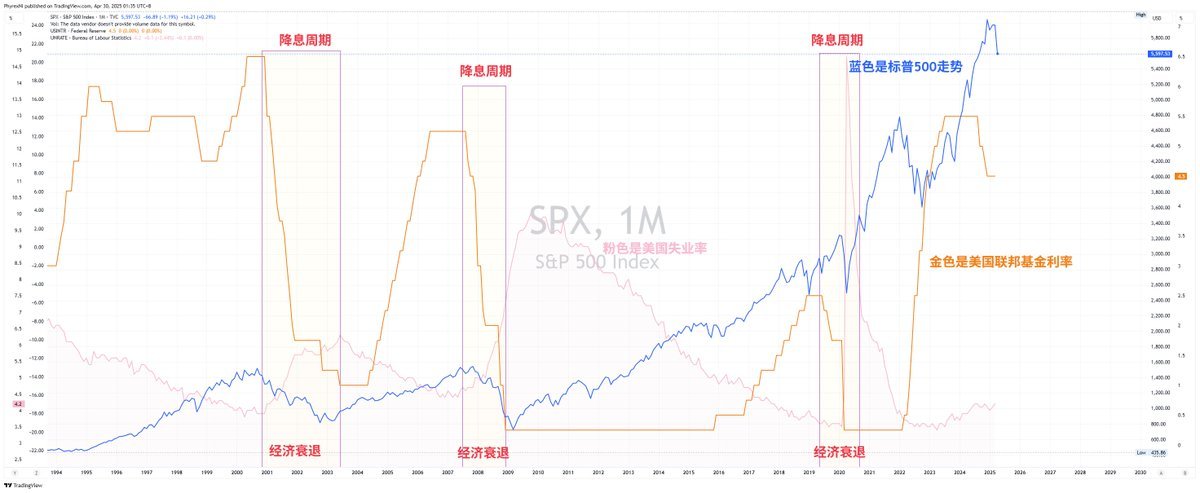
在比如这张图,是我放在月报里用的,阐述的是降息和风险市场的关系,并不代表了降息就会提升美股或者是加密货币的价格,更重要的是要看美国的经济是否会陷入衰退。这就是从大方向上动手,然后找细节的数据加以佐证。
最后我想说的是,“市场往往走出反逻辑”这一条如果是短期看是偶尔成立的,成立性也不高,但从长期来看,市场走出反逻辑几乎是不可能的,并不是因为有只手在操作,更多的是事件本身就是多层叠加的,越是纠结在短时间数据给出的答案可能越模糊。
所以最终你的问题是对的,趋势性的交易是注重大方向的,比如在川普宣布暂停关税90天的时候,就是最好的买入点,因为这就代表了情绪的趋势。
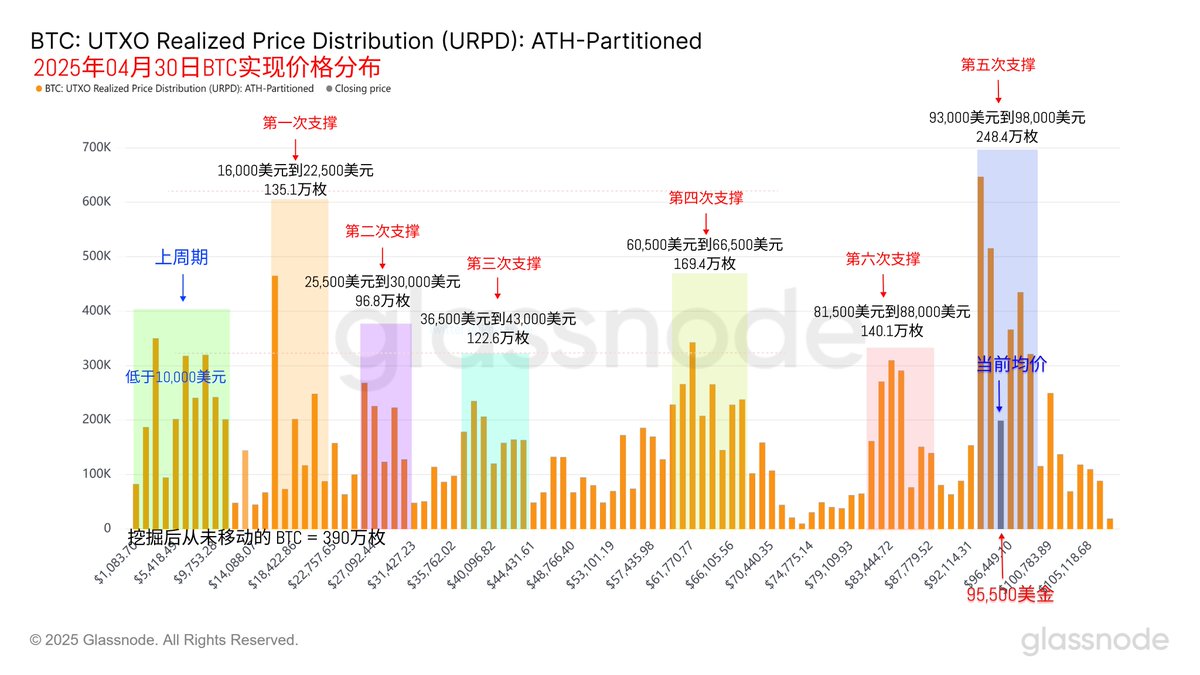
而在数据中 URPD 给出的 93,000 美元到 98,000 美元的支撑就是最好的证明,短期来看,很多人说跌破了为什么叫支撑,而长期来看,正是因为这部分的投资者没有大规模离场,所以对价格的压力并不大,而目前这部分的支撑反而是变成了阻力。
而这个阻力可能需要新的利好来冲破,但一旦出现了新的宏观利空,比如经济衰退,那么价格下跌的概率就会很大,这就是趋势性的交易,更多的注重高确定性的数据,事件和周期性。
本推文由 @ApeXProtocolCN 赞助|Dex With ApeX
免责声明:本文章仅代表作者个人观点,不代表本平台的立场和观点。本文章仅供信息分享,不构成对任何人的任何投资建议。用户与作者之间的任何争议,与本平台无关。如网页中刊载的文章或图片涉及侵权,请提供相关的权利证明和身份证明发送邮件到support@aicoin.com,本平台相关工作人员将会进行核查。


