我们看一下今天的市场行情分析,比特币已经收了所谓的这种周线,周线级别
出现了实体的大阳线

从周线级别来去看,目前比特币依旧有上升的这种可能,另外比特币已经实现了
三连阳了
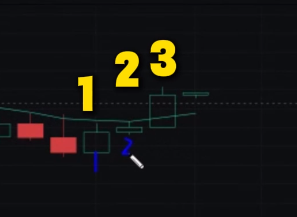
从这个角度来看,有裸K角度我们讲的就是横三兵这种迹象,横三兵代表了后续涨幅依旧强劲,从目前情况来看短期,比特币依旧有上行的那个空间,如果说继续上行,前期9万6到9万8这个地方是一个周线级别,破位的一个地方。
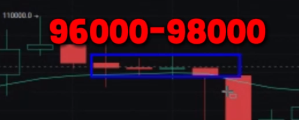
当时在这个地方横盘之后,出现了这种大差间,后来实体收线破位,穿下来的
这次价格再次来到这个地方,短期这个地方96,000-98,000这个区间是一个不小的一个阻力位,届时我们就要关注冲高之后,我们多单止盈或者说部分减仓,我们空单可以部分入场的这个机会,我们要关注这是从周线级别来去看的。
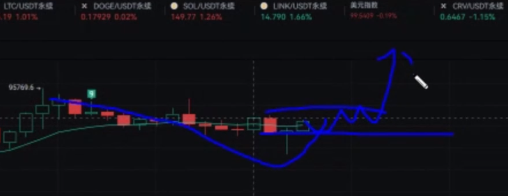
分析完周线级别,那我们再去看一下日线级,看一下4小时短期有回调的这种风险,不出我们所料价格达到了 92,000 ,92,600 出现了这种小幅度的回调,回调之后然后接着又快速拉起,价格重新收回到昨天这个价格。94,000之上。

目前价格说白了还是从这个大角度来讲,在这个区间做这个盘整震荡,但从小周期来讲的话
这个地方算作是一次回踩,但是力度不深重新收上来,如果说这次插针之后重新收上去,在这个地方盘整的话,那大概率还是要往上走的。
那上方就是我们说的这个96,000-98,000我们要重点关注就可以了。
如果说这个地方盘整之后冲不上去,那下方依旧我们还是以关注,91,500这个地方为第一个支撑点,第二个支撑点就是我们说的8万8-9万这个区间。
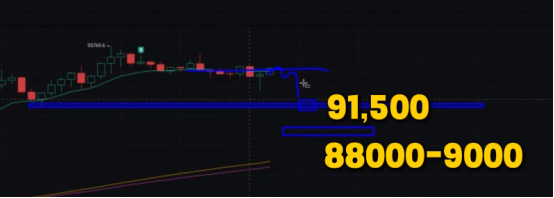
短期比特币会下方就这两个比较强的一个支撑,那我们依旧按照两个支撑去布局我们单的就可以了。
我们看一下以太坊,以太坊没有什么大的变化,只不过这个周线收出了我们所期待的这种上涨的阳线,从这个周线级别角度也形成了周线级别的黎明之星。
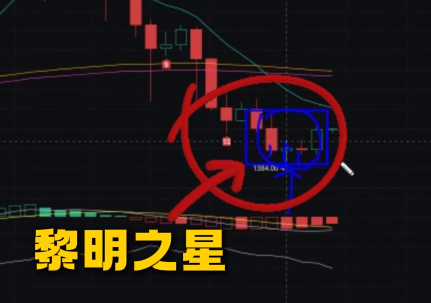
周线级别的黎明之星那接下来更多的我们还是要以多头为主。
从周线的角度,上方就是1960-2,000这个点,届时我们关注这个区间就可以了
我们切到4小时短期看一下上方围绕着1860这个点去博弈。
我们的空单只要一天过不去可以在这个区间里边去做高抛低吸,那下方我们就围绕着这个1720这个区间我们去做这个高抛低吸就可以了。
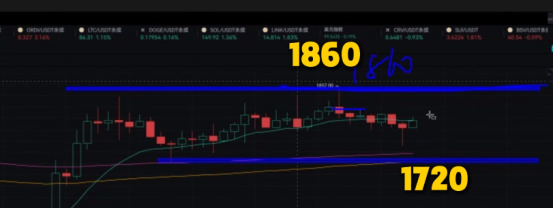
如果说以太坊在这个地方迟迟下不去的话,那大概率就要往上突了,所以说我们持有空单的
一定要带好止损。
如果说你对于做单子感觉到比较迷茫无从下手,关注我们的公众号:KK攻略

免责声明:本文章仅代表作者个人观点,不代表本平台的立场和观点。本文章仅供信息分享,不构成对任何人的任何投资建议。用户与作者之间的任何争议,与本平台无关。如网页中刊载的文章或图片涉及侵权,请提供相关的权利证明和身份证明发送邮件到support@aicoin.com,本平台相关工作人员将会进行核查。


