本周预览(4.28-5.4),各大概念板块轮动流入,GBTC年收入2.68亿,超其他ETF收入总和
目录:
1.本周大额代币解锁数据;
2.加密市场全览,速读一周热门币种涨跌/板块资金流;
3.比特币现货ETF动态;
4.BTC清算地图数据解读;
5.本周重点宏观事件与加密市场重点预告。
1.本周大额代币解锁数据;
本周多种代币将迎来一次性解锁。按解锁价值排序如下:
SUI、OMNI、OP等代币将于下周迎来大额解锁,其中:
Sui(SUI)将于5月1日上午8点解锁约7400万枚代币,与现流通量的比例为2.28%,价值约2.67亿美元;
Omni Network(OMNI)将于5月2日晚上7点解锁约1598万枚代币,与现流通量的比例为83.51%,价值约4220万美元;
Optimism(OP)将于4月30日上午8点解锁约3134万枚代币,与现流通量的比例为1.89%,价值约2570万美元;
Kamino(KMNO)将于4月30日晚上8点解锁约2.29亿枚代币,与现流通量的比例为16.98%,价值约1450万美元;
Ethena(ENA)将于5月2日下午3点解锁约4063万枚代币,与现流通量的比例为0.73%,价值约1420万美元;
ZetaChain(ZETA)将于5月1日上午8点解锁约4426万枚代币,与现流通量的比例为5.67%,价值约1130万美元。
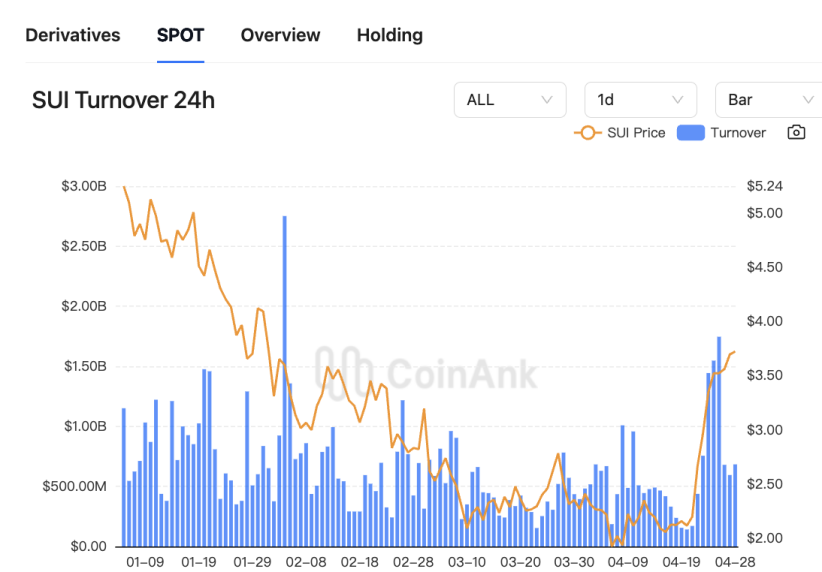
这些项目的解锁情况或许会对相关市场产生不同程度的影响。以上为UTC+8时间,图为coinank 数据。
我们认为,本周代币集中解锁事件对市场的影响可从供需动态与项目背景两方面解读。SUI以2.67亿美元解锁规模居首,但仅占流通量的2.28%,短期内抛压相对可控。历史数据显示,SUI多次大额解锁后价格波动较小,可能因项目方通过生态合作(如集成USDC)和营销手段提前对冲风险。而OMNI的解锁比例高达83.51%,流通量骤增可能引发剧烈波动,需警惕持有者集中抛售。
OP、ENA等代币解锁比例均低于5%,属于常规释放节奏。结合过往案例(如OP在2024年多次解锁后价格韧性较强),此类低比例解锁对市场冲击有限,但需关注同期市场情绪。值得注意的是,ZETA和KMNO的解锁占比分别为5.67%和16.98%,虽绝对值不高,但若项目生态进展滞后,可能放大负面效应。
从策略层面看,项目方倾向于在解锁前释放利好信息,例如SUI近期推进游戏硬件SUIPlay0XI并引入机构合作,或为缓解抛压做准备。此外,高流通量项目(如SUI当前流通量超2.7亿枚)的市场深度较好,流动性缓冲能力较强,而新兴项目(如OMNI)因流动性不足更易受冲击。
所以,投资者需差异化评估:SUI等主流代币短期风险可控,但需关注后续解锁节奏;OMNI等高占比项目波动风险突出;OP、ENA等或延续平稳走势。建议结合项目基本面与解锁后的链上数据(如巨鲸持仓变化)动态调整策略。
2.加密市场全览,速读一周热门币种涨跌/板块资金流
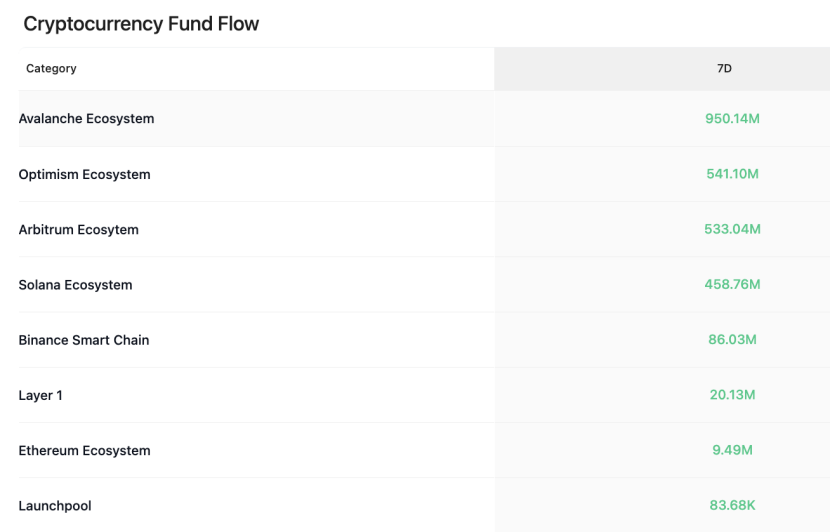
CoinAnk数据显示,过去一周,加密市场按概念板块划分,Avalanche生态、Optimism生态、Arbitrum生态、Solana生态、#BSC 、以太坊生态和Launchpool这些板块实现资金净流入。
近7天,币种涨幅榜单如下(选取市值前500),PENGU、MYRO、VIRTUAL、ARC 和MICHI等代币涨幅相对靠前,本周可继续优先关注强势币种交易机会。
3.比特币现货ETF资金动态。
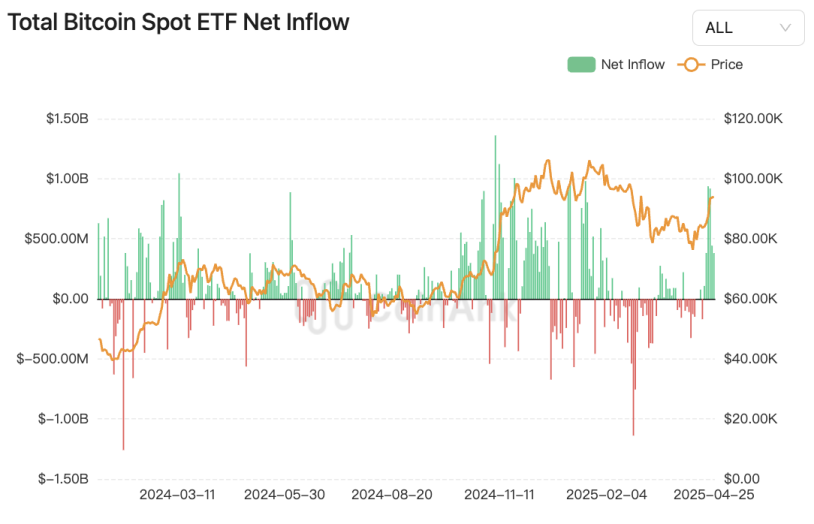
CoinAnk数据显示,上周美国比特币现货 ETF 累计净流入 30.629 亿美元,5 个交易日均为资金净流入状态。在现货比特币ETF推出近16个月后,灰度的GBTC在收入创造方面依然占据主导地位,隐含年收入超过2.68亿美元,超过了所有其他比特币ETF的收入总和(2.11亿美元)。
我们认为,从研究员视角分析,美国比特币现货ETF近期资金流动呈现显著分化特征。数据显示,上周(截至2025年4月28日当周)比特币现货ETF累计净流入30.6亿美元,连续5个交易日保持资金净流入,表明市场对加密资产的配置需求仍具韧性。然而,灰度(Grayscale)的GBTC却展现出独特的市场地位:尽管其资金长期处于净流出状态(历史累计流出超200亿美元),但其隐含年收入仍高达2.68亿美元,超过其他所有比特币ETF收入总和(2.11亿美元),这主要源于其庞大的存量规模和高费率结构。
从竞争格局看,贝莱德IBIT和富达FBTC等新兴ETF凭借低费率策略持续吸引增量资金,例如IBIT单周曾创下21.5亿美元净流入的峰值。但灰度通过品牌积淀和先发优势,仍占据收入主导地位。这种"存量规模创造收入,增量竞争分流资金"的双轨现象,反映出ETF市场从早期垄断向多元化竞争的过渡。值得注意的是,尽管GBTC长期面临资金外流压力,但近期数据显示其单日净流出已从数千万美元降至百万级,甚至偶现净流入,暗示市场情绪可能边际改善。
从宏观影响看,现货比特币ETF总资产净值已突破千亿美元级别,占比特币总市值比例超过5%,其资金流动已成为影响币价波动的重要因子。研究员认为,当前ETF市场的结构性矛盾(收入集中与资金分散)可能推动产品创新,例如灰度推出迷你BTC ETF尝试平衡费率与规模,而贝莱德等机构则通过持续流入巩固市场份额。未来需关注监管政策变化和机构投资者行为对资金流向的再平衡作用。
4. BTC清算地图数据。
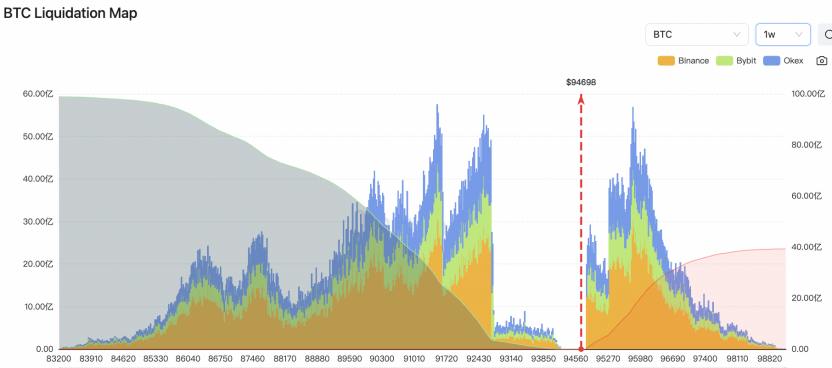
CoinAnk 清算地图数据显示,如果BTC突破99000美元,主流CEX累计空单清算强度将达39.25亿美元。 反之,如果比特币跌破90000美元,主流CEX累计多单清算强度将达54.32亿美元。
我们认为,当前比特币价格在关键阈值附近的多空博弈呈现出显著的非对称性风险结构。若BTC突破99,000美元,可能触发39.25亿美元的空单清算,这源于价格上行时大量高杠杆空头头寸的集中止损,形成“空头挤压”效应。此类连锁清算可能加剧流动性波动,推动价格进一步突破阻力位。反之,若跌破90,000美元,高达54.32亿美元的多单清算压力将释放,反映市场在回调预期下的脆弱性,可能引发多杀多的螺旋式下跌。
不同时期数据显示,清算阈值与强度随市场杠杆水平和持仓结构动态变化。例如,2025年2月数据显示,跌破95,000美元仅触发2.29亿多单清算,但同年4月同类阈值下的强度已飙升至数十亿美元级别,表明市场风险敞口在牛市中显著放大。需注意清算图反映的是相对强度而非绝对金额,其本质是价格触及特定区域时流动性冲击的概率评估。当前多空清算强度的悬殊差距(54.32亿vs39.25亿),暗示市场对下行风险的定价更为敏感,或与近期衍生品市场多头过度拥挤相关。这种非线性清算压力可能使价格在关键位附近呈现剧烈波动,投资者需警惕流动性枯竭引发的极端行情。
5.本周重点宏观事件与加密市场重点预告。
日期 | 星期 | 重要事件 |
4月28日 | 周一 | 加拿大举行联邦选举 |
4月30日 | 周三 | 1. 美国3月核心PCE物价指数年率(22:00) |
5月1日 | 周四 | 1. 美国当周初请失业金人数(20:30) |
5月2日 | 周五 | 1. 美国4月失业率(20:30) |
我们认为,本周加密市场的核心矛盾集中于美国经济数据与政策博弈的联动效应。周五的非农就业和失业率数据将成为美联储货币政策预期的关键指引:若数据疲软(如新增就业低于预期或失业率上升),可能强化市场对年内四次降息的押注,从而推动风险资产回暖;反之若数据强劲,将加剧对高利率维持时间的担忧,压制市场情绪。当前BTC隐含波动率降至45%低位,显示投资者对短期方向缺乏共识,但这也为数据公布后的波动率反弹埋下伏笔。
值得注意的是,特朗普政策对市场的扰动仍具持续性。此前其关税政策曾导致加密资产大幅波动(BTC跌幅显著大于ETH),而近期口风缓和又引发市场逆转性反弹。这种政策不确定性使加密资产与传统风险资产的联动性增强,特别是在美股疲弱但未现衰退的背景下,资金可能加速在股债市场与加密市场间轮动。
对加密市场的具体影响路径可能呈现双向波动特征:一方面,疲弱经济数据带来的降息预期可能推动BTC测试10万美元心理关口;另一方面,就业市场韧性可能延续当前震荡格局。中期需警惕政策面黑天鹅(如新关税措施)与流动性预期的反复修正。建议投资者重点关注期权市场的对冲需求变化及ETF资金流入持续性,这两大指标将反映机构资金对系统性风险的评估。
免责声明:本文章仅代表作者个人观点,不代表本平台的立场和观点。本文章仅供信息分享,不构成对任何人的任何投资建议。用户与作者之间的任何争议,与本平台无关。如网页中刊载的文章或图片涉及侵权,请提供相关的权利证明和身份证明发送邮件到support@aicoin.com,本平台相关工作人员将会进行核查。


