In Bitcoin investment, there has never been a shortage of asymmetric opportunities, and there are many.
Author: Daii
Today, the price of Bitcoin has once again surpassed the $90,000 mark, and market sentiment is high, with social media filled with cheers of "the bull is back." But for those investors who hesitated at $80,000 and missed the opportunity to get on board, this moment feels more like an inner interrogation: Am I too late again? Should I decisively buy during a pullback? Will I have another chance in the future?
This is precisely the key point we want to discuss: In an asset like Bitcoin, known for its extreme volatility, is there really a "value investment" perspective? Can a strategy that seems contrary to its "high risk, high volatility" nature capture an "asymmetric" opportunity in this turbulent game?
The so-called asymmetry in the investment world refers to the potential returns being far greater than the potential losses, or vice versa. It sounds like this is not a characteristic of Bitcoin. After all, most people's impression of Bitcoin is: either you get rich overnight or you lose everything.
However, behind this polarized perception lies a neglected possibility—during the phases of Bitcoin's periodic deep declines, the methodology of value investing may create an extremely attractive risk-reward structure.
Looking back at Bitcoin's history, it has experienced several crashes of over 80%, even 90%, from its peaks. At such moments, the market is shrouded in panic and despair, and capitulation selling makes the price look like it has been knocked back to its original form. But for those investors who have a deep understanding of Bitcoin's long-term logic, this represents a typical "asymmetry"—limited risk in exchange for potentially enormous returns.
Such opportunities are not easily accessible. They test the investor's level of understanding, emotional control, and willpower to hold long-term. This also raises a more fundamental question: Do we have reason to believe that Bitcoin truly has "intrinsic value"? And if it does, how should we quantify it, understand it, and formulate our investment strategies accordingly?
In the following content, we will officially embark on this exploratory journey: revealing the deep logic behind Bitcoin's price fluctuations, clarifying how asymmetry shines during times of "blood in the streets," and contemplating how the principles of value investing can be revitalized in this decentralized era.
However, one thing you should first understand is that there has never been a shortage of asymmetric opportunities in Bitcoin investment, and there are many.
1. Bitcoin: Why Are There So Many Asymmetric Opportunities?
If you scroll through Twitter today, you will see an overwhelming celebration of the Bitcoin bull market. The price has once again surged past the $90,000 mark, and many are shouting on social media as if the market forever belongs to prophets and the lucky ones.
But if you look back, you will find that the invitation to this feast was actually sent out long ago, at the most desperate moments of the market; it’s just that many people lacked the courage to click on it.
1.1 Historical Asymmetric Opportunities
Bitcoin has never followed a straight upward trajectory; its growth history is a script interwoven with extreme panic and irrational prosperity. Behind each of its deepest declines lies an extremely attractive "asymmetric opportunity"—the maximum loss you bear is limited, while the potential gains can be exponential.
Let’s take a time-traveling journey and let the data speak.
2011: -94%, from $33 to $2
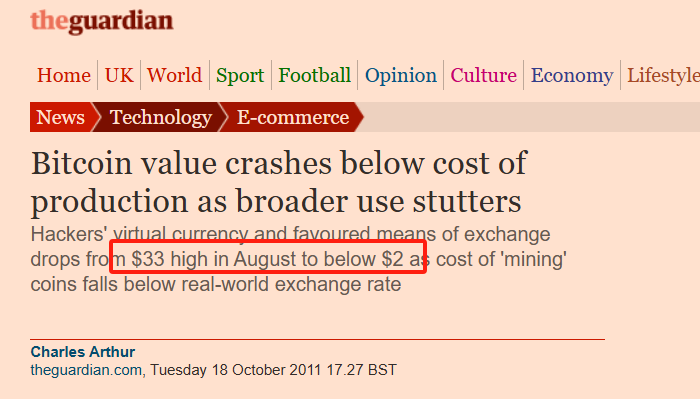
That was the moment Bitcoin was "widely seen" for the first time, with the price soaring from a few dollars to $33 within six months. But soon, a crash followed. The price of Bitcoin plummeted to $2, a drop of 94%.
You can imagine the despair: major geek forums were silent, developers fled, and even core contributors to Bitcoin posted doubts about the project's prospects.
But if you had "bet once" at that time, buying in with $1,000, you would have held $5 million worth of BTC years later when the price broke $10,000.
2013 - 2015: -86%, Mt. Gox Collapse
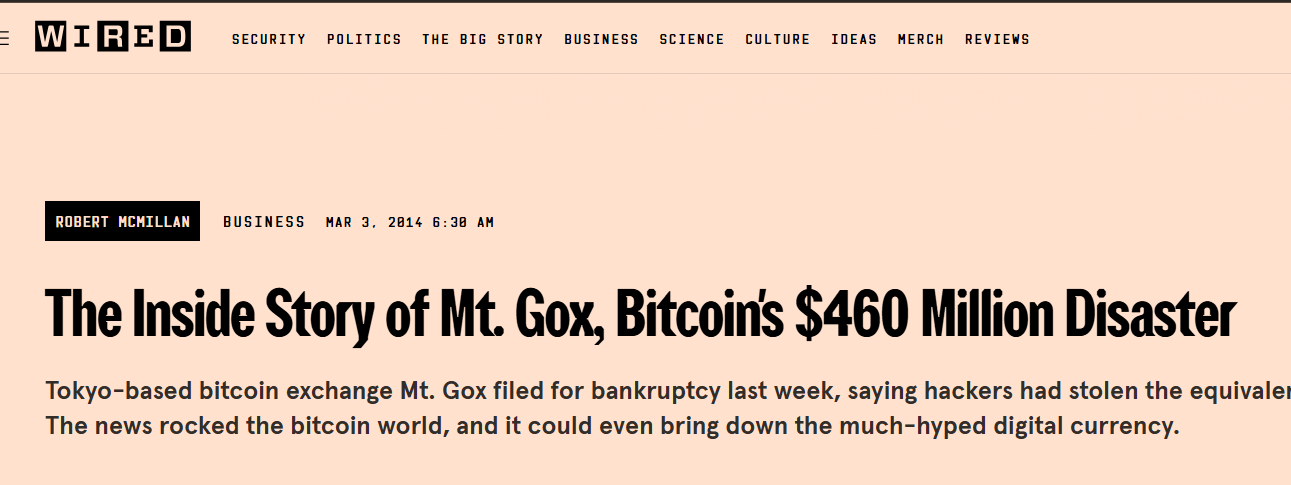
At the end of 2013, Bitcoin's price first broke $1,000, attracting global attention. But the good times didn’t last long; in early 2014, the world's largest Bitcoin exchange, Mt. Gox, announced its collapse, with 850,000 Bitcoins disappearing from the blockchain.
Overnight, the media uniformly declared, "Bitcoin is finished." CNBC, BBC, and The New York Times all reported the Mt. Gox scandal on their front pages, and the BTC price fell from $1,160 to $150, a drop of over 86%.
But what happened later? By the end of 2017, the same Bitcoin was priced at $20,000.
2017 - 2018: -83%, ICO Bubble Burst
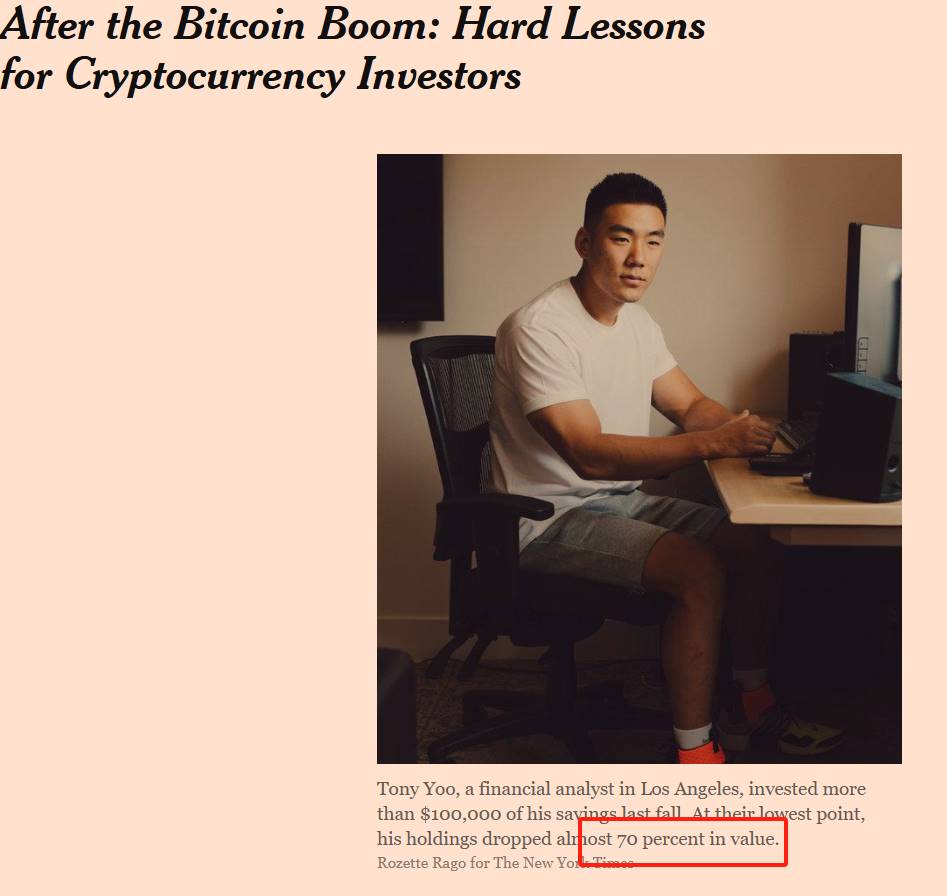
The above image is a report from The New York Times about this major drop, with the text in the red box stating that this investor lost 70% of their position value.
2017 was the year Bitcoin entered the public eye as the "year of mass speculation." Numerous ICO projects emerged, with white papers filled with terms like "disrupt," "reshape," and "decentralized future," leading the entire market into a frenzy.
But as the tide receded, Bitcoin fell from nearly $20,000 to $3,200, a drop of over 83%. That year, Wall Street analysts scoffed, saying, "Blockchain is a joke"; the SEC filed numerous lawsuits; retail investors were liquidated and exited, leaving the forums silent.
2021 - 2022: -77%, Industry "Black Swan" Series of Explosions
In 2021, Bitcoin wrote a new myth: the price of a single coin surpassed $69,000, with institutions, funds, countries, and retail investors rushing in.
But just a year later, BTC fell to $15,500. The collapse of Luna, the liquidation of Three Arrows Capital, the FTX explosion… a series of "black swans" toppled the entire crypto market's confidence like a row of dominoes. The fear and greed index once dropped to 6 (extreme fear zone), and on-chain activity nearly froze.
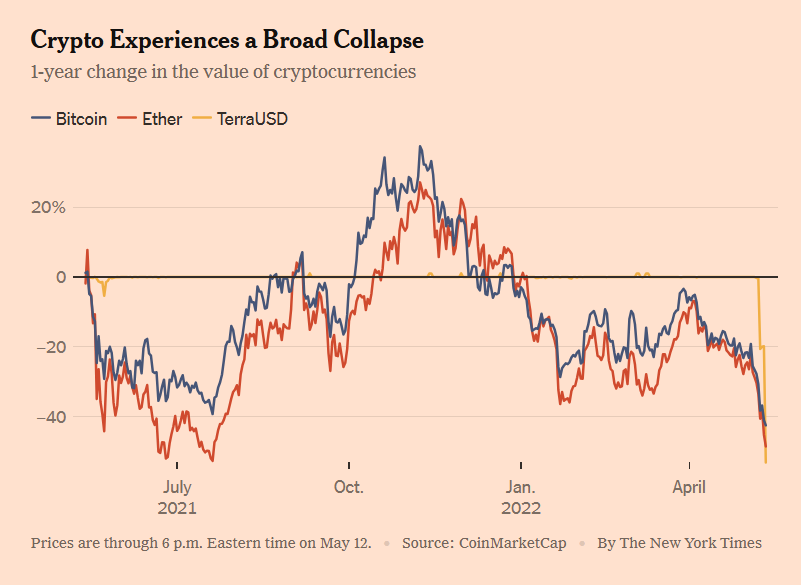
The above image is from a May 12, 2022 report by The New York Times, showing the prices of Bitcoin and Ethereum plummeting alongside UST. Now we know that behind UST's crash, there was actually Galaxy Digital's role in propping up Luna for offloading.
But once again, by the end of 2023, Bitcoin quietly rose back to $40,000; after the approval of the ETF in 2024, it surged all the way to today's $90,000.
1.2 Where Do Bitcoin's Asymmetric Opportunities Come From?
We have seen that Bitcoin has achieved astonishing rebounds multiple times in moments that seemed like "apocalyptic disasters." So the question arises—why is this? Why does this high-risk asset, which has been ridiculed by countless people as a "game of musical chairs," repeatedly rise again after crashes? More importantly, why can it provide such highly asymmetric investment opportunities for patient and knowledgeable investors?
The answer lies in three core mechanisms:
Mechanism One: Deep Cycles + Extreme Emotions Create Pricing Deviations
Bitcoin is the only global market that operates 24/7 without closing. There are no circuit breakers, no market maker protections, and no Federal Reserve safety nets. This means it is more susceptible to amplifying human emotional fluctuations than any other asset.
In a bull market, FOMO (fear of missing out) dominates the market, retail investors chase prices wildly, narratives soar, and valuations are severely overstretched;
In a bear market, FUD (fear, uncertainty, doubt) permeates the internet, voices of capitulation abound, and prices are trampled into the dust.
This cycle of emotional amplification frequently puts Bitcoin in a state of "price severely deviating from true value." And this is precisely the breeding ground for value investors seeking asymmetric opportunities.
In summary: the market is a voting machine in the short term, but a weighing machine in the long term. Bitcoin's asymmetric opportunities precisely appear in those moments when the weighing machine has not yet been turned on.
Mechanism Two: Huge Price Volatility, but Extremely Low Probability of Death
If Bitcoin were truly as "likely to go to zero" as the media portrays, then it would have no investment significance. But the reality is that it has "survived" every crisis and has come back stronger each time.
In 2011, after the price crashed to $2, the Bitcoin network continued to operate as usual, and transactions went on.
After the collapse of Mt. Gox in 2014, new exchanges quickly filled the void, and the number of users continued to grow.
After the FTX explosion in 2022, the Bitcoin blockchain still produced blocks steadily every 10 minutes.
Bitcoin's underlying network has almost no history of downtime, and its system robustness far exceeds most people's perceptions.
In other words, even if the price is halved again and again, as long as Bitcoin's technological foundation and network effects remain, it has no real risk of "going to zero." Thus, we arrive at a very attractive structure: the short-term downside is limited, but the long-term upside is open.
This is asymmetry.
Mechanism Three: Value Anchoring Exists but Is Overlooked, Leading to "Overselling"
Many people believe that Bitcoin has no intrinsic value, hence the decline has no bottom. This view overlooks several key facts:
Bitcoin has programmatic scarcity (21 million coins, halving mechanism);
It possesses the world's most powerful POW network, with calculable costs;
It has strong network effects, with user numbers exceeding 50 million, and transaction volume and hash rate hitting new highs;
Mainstream institutions and countries recognize its "reserve asset" attributes (ETFs, national fiat currencies, corporate balance sheets);
This is also the most controversial issue: does Bitcoin have intrinsic value? We will elaborate on this shortly.
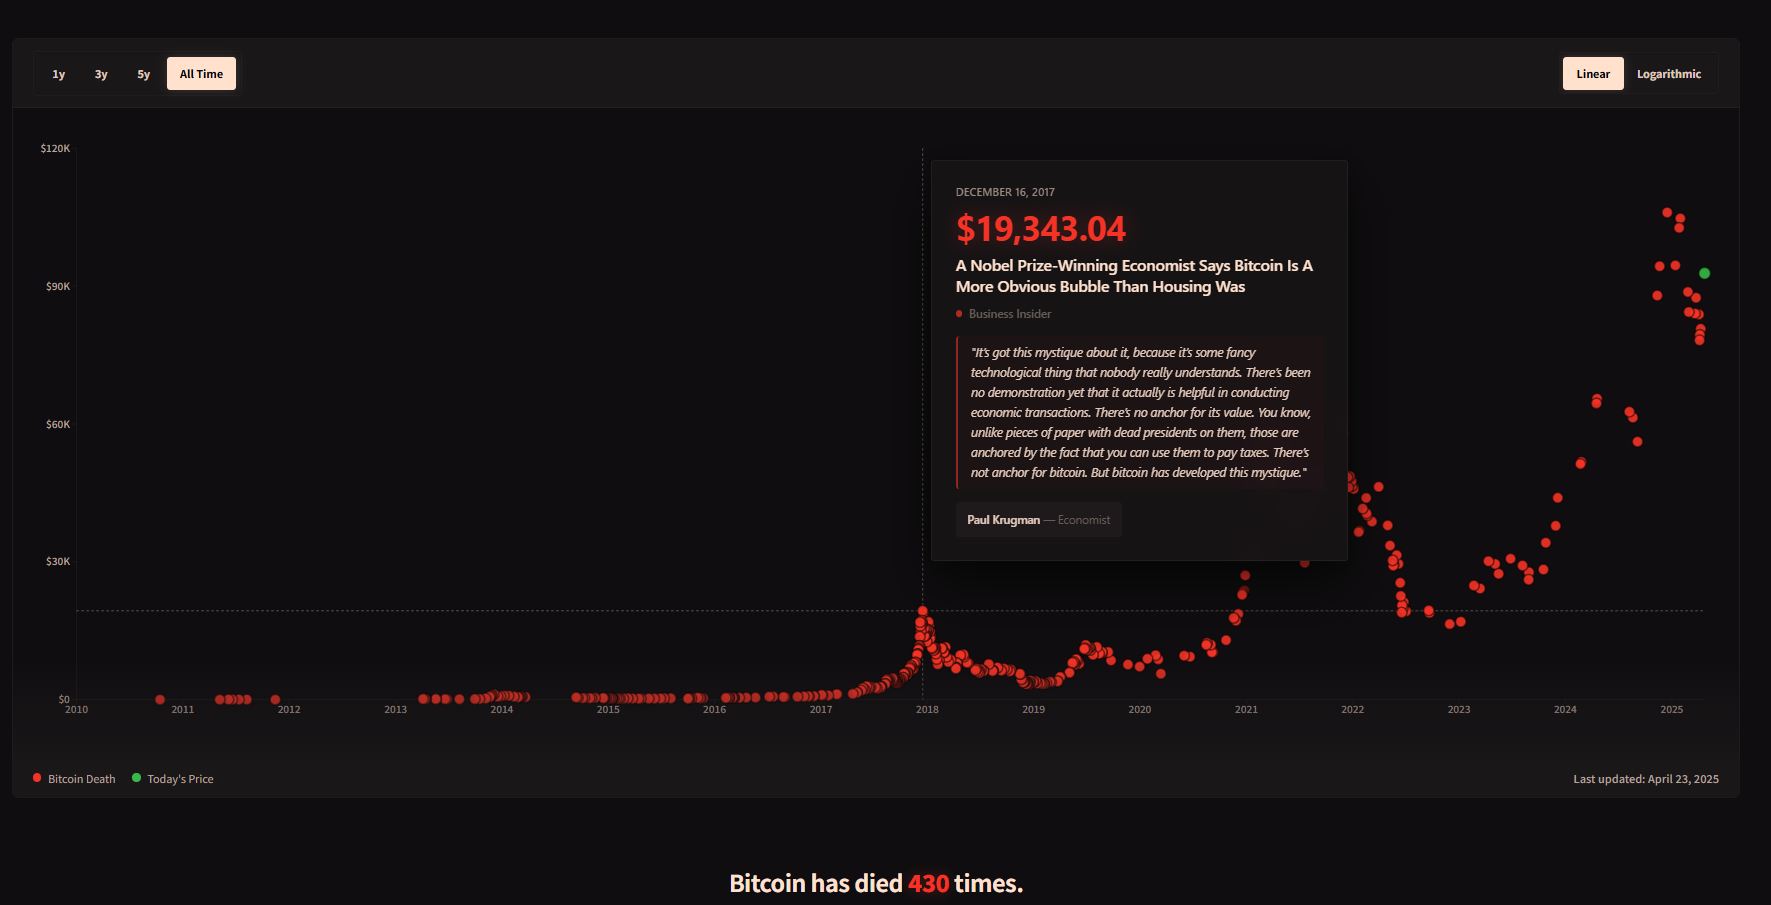
1.3 Will Bitcoin Go to Zero?
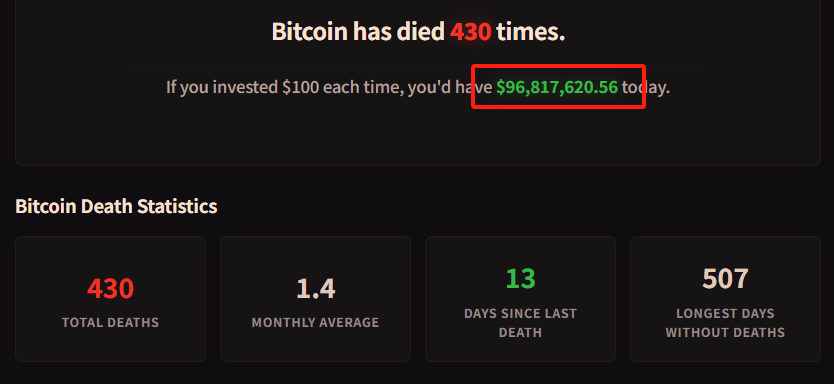
It is possible, but the probability is extremely low. This website records 430 instances of Bitcoin being declared dead.
However, below the number of death declarations, there is a small line that tells everyone. If you had bought $100 worth of Bitcoin every time someone declared it dead, you would now have over $96.8 million, as shown in the image below.
You should know that Bitcoin's underlying system has been operating stably for over a decade, almost without interruption. Whether it was the collapse of Mt. Gox, the crash of Luna, or the FTX explosion, its blockchain has consistently produced blocks every 10 minutes. This technological resilience provides a strong survival baseline.
Now you should understand that Bitcoin is not a "logically unfounded speculative asset." On the contrary, its asymmetry is so prominent because its long-term value logic genuinely exists, yet it is often severely underestimated by market sentiment.
This leads us to the next question we must explore—can Bitcoin, which has no cash flow, no board of directors, no factories, really be considered for "value investing"?
2. Can Bitcoin Be Valued as an Investment?
Bitcoin always experiences extreme price fluctuations, swinging between extreme greed and extreme fear. Is such an asset really suitable for "value investing"?
On one side, there is Graham and Buffett's concept of "margin of safety" and "discounted cash flow," while on the other side is a "digital commodity" with no board of directors, no dividends, no profits, and no corporate entity. Within the traditional value investing framework, Bitcoin seems to have no place.
But the key to the problem lies in how you define "value."
If we broaden our perspective beyond traditional financial reports and dividends, returning to the core essence of value investing—
Buying at a price below intrinsic value and holding until value returns.
Then, Bitcoin may not only be suitable for value investing but may even embody the original meaning of "value" more purely than many stocks.
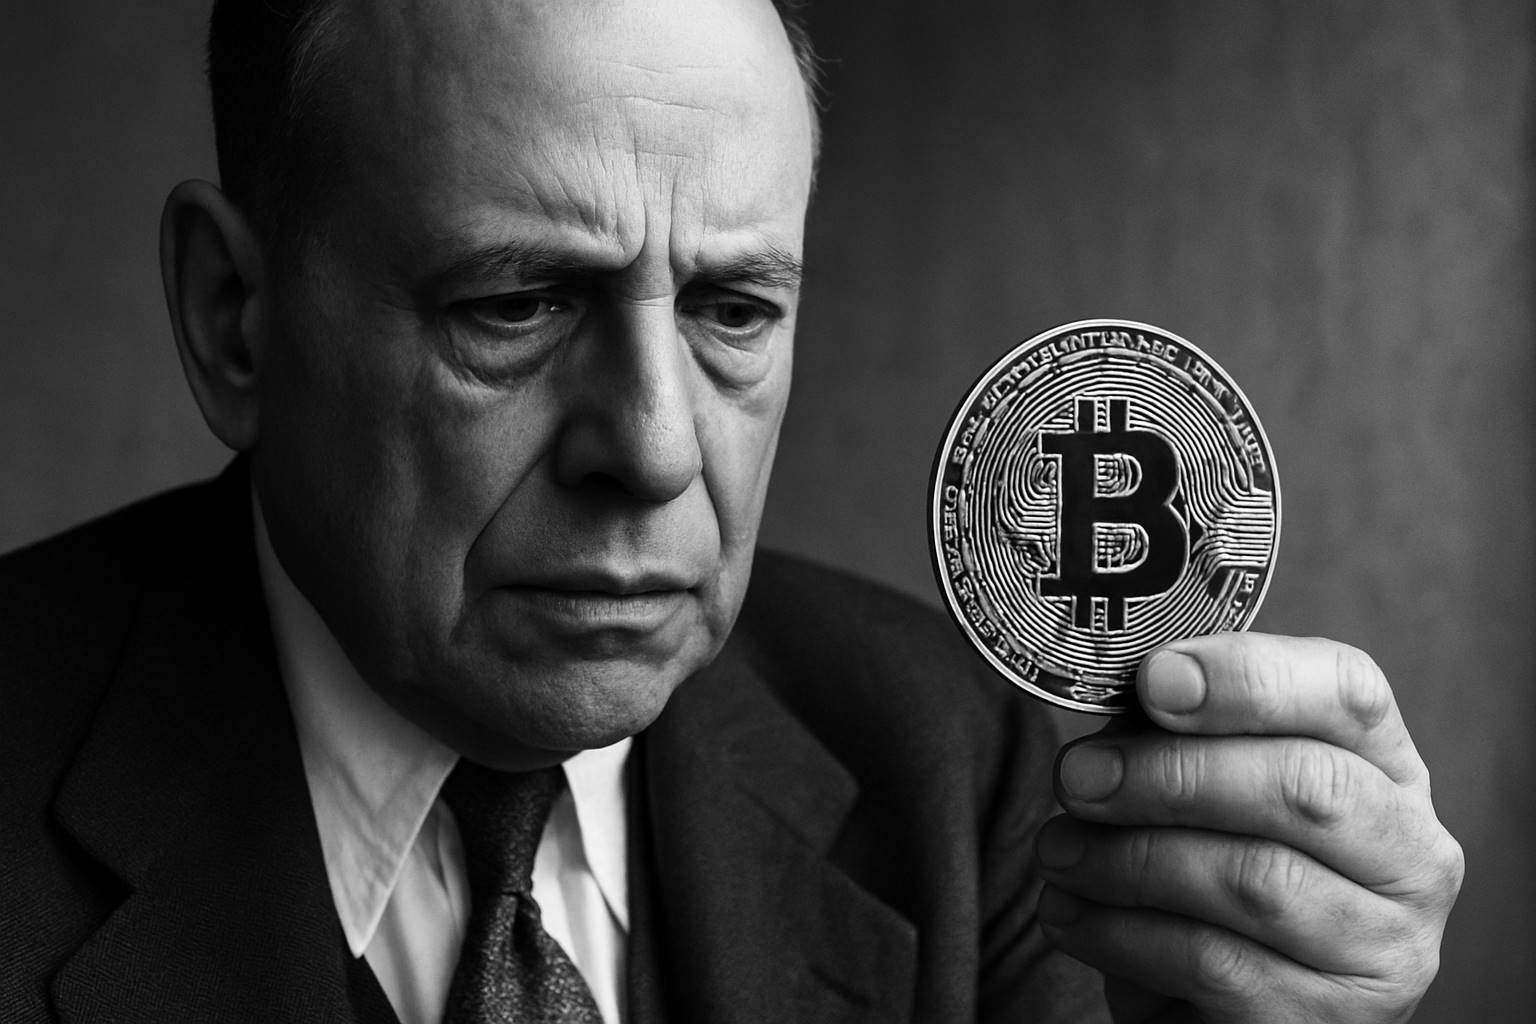
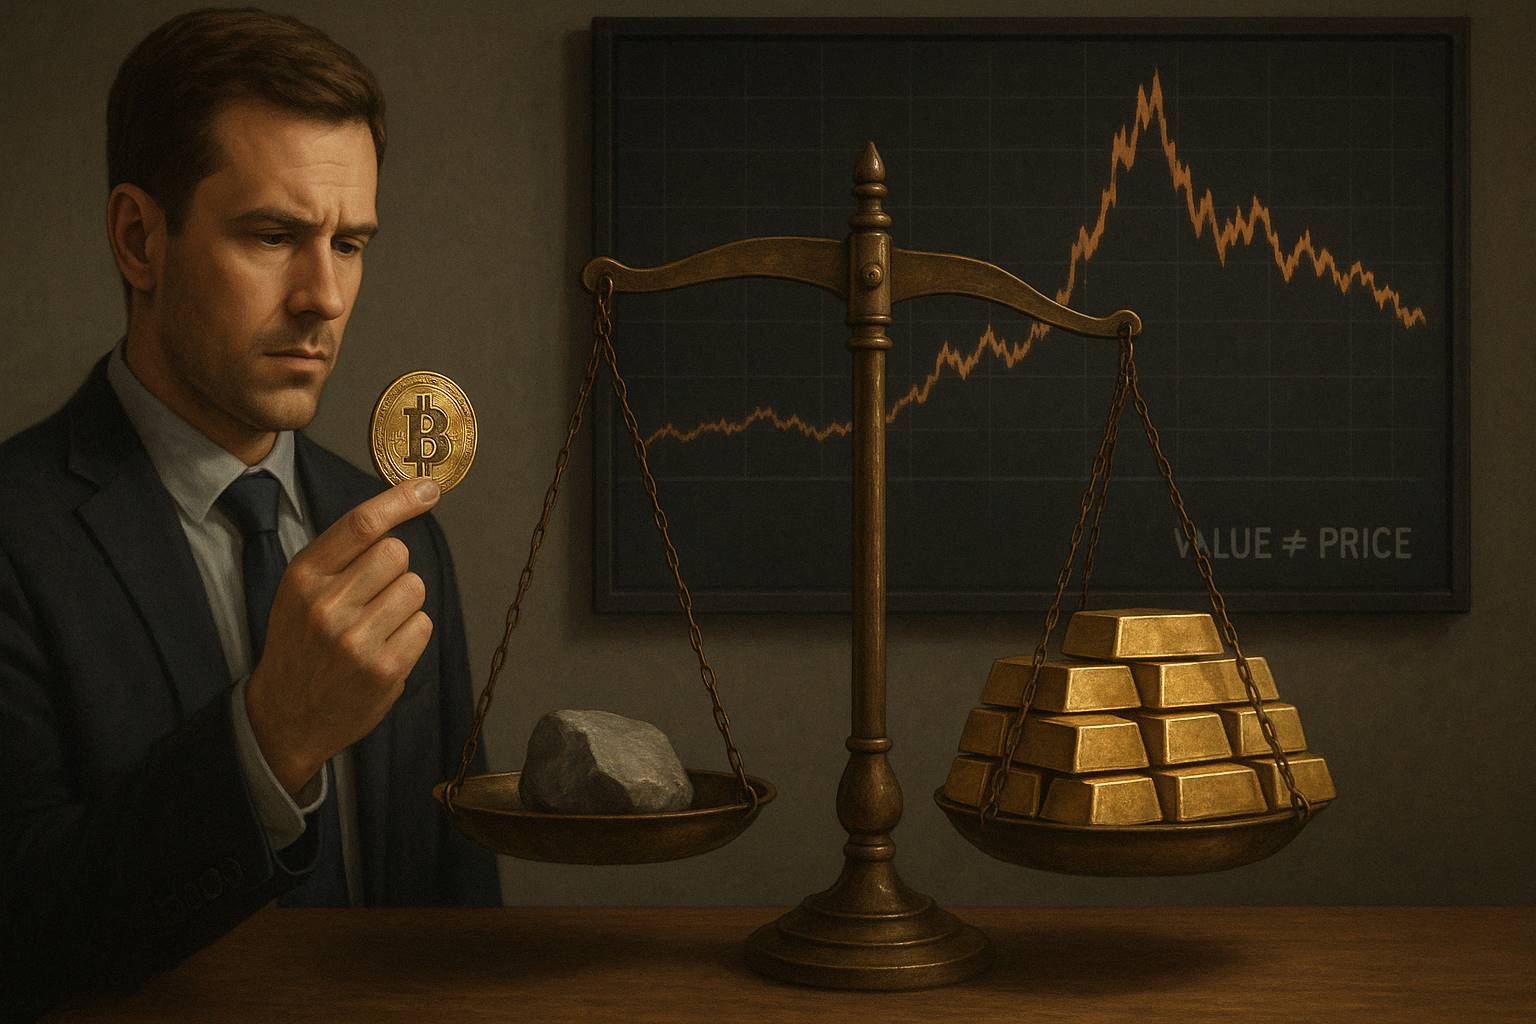
Benjamin Graham, the founder of value investing, once said: The essence of investing lies not in what you buy, but in whether the price you pay is below its value. The image above is an AI-generated depiction of Graham looking puzzled at Bitcoin.
In other words, value investing is not limited to stocks, companies, or traditional assets. As long as something has intrinsic value and the market price is temporarily below that value, it can become a target for value investing.
But this also raises a more critical question: If we cannot estimate Bitcoin's value using traditional metrics like price-to-earnings or price-to-book ratios, where does its "intrinsic value" come from?
Although Bitcoin does not have financial statements like a company, it is far from empty. It possesses a complete set of analyzable, modelable, and quantifiable value systems. Although these "value signals" are not concentrated in a quarterly report like stocks, they are equally real and even more stable.
Below, I will primarily analyze the sources of Bitcoin's "intrinsic value" from the dimensions of supply and demand.
2.1 Supply Side: Scarcity, a Programmatically Defined Deflation Model (Stock-to-Flow)
The fundamental pillar of Bitcoin's value is its verifiable scarcity.
Total supply cap: 21 million coins, no inflation;
Halving every four years: Each halving reduces the annual supply by 50%, with all coins expected to be issued by 2140;
After the 2024 halving, Bitcoin's annual new supply will drop to an inflation rate of less than 1%, making it scarcer than gold.
Analyst PlanB's S2F model (Stock-to-Flow) has accurately captured Bitcoin's medium- to long-term upward trend after halving multiple times—after the 2012, 2016, and 2020 halvings, the price saw several-fold increases within 12-18 months, as shown by the first three blue arrows in the image below.
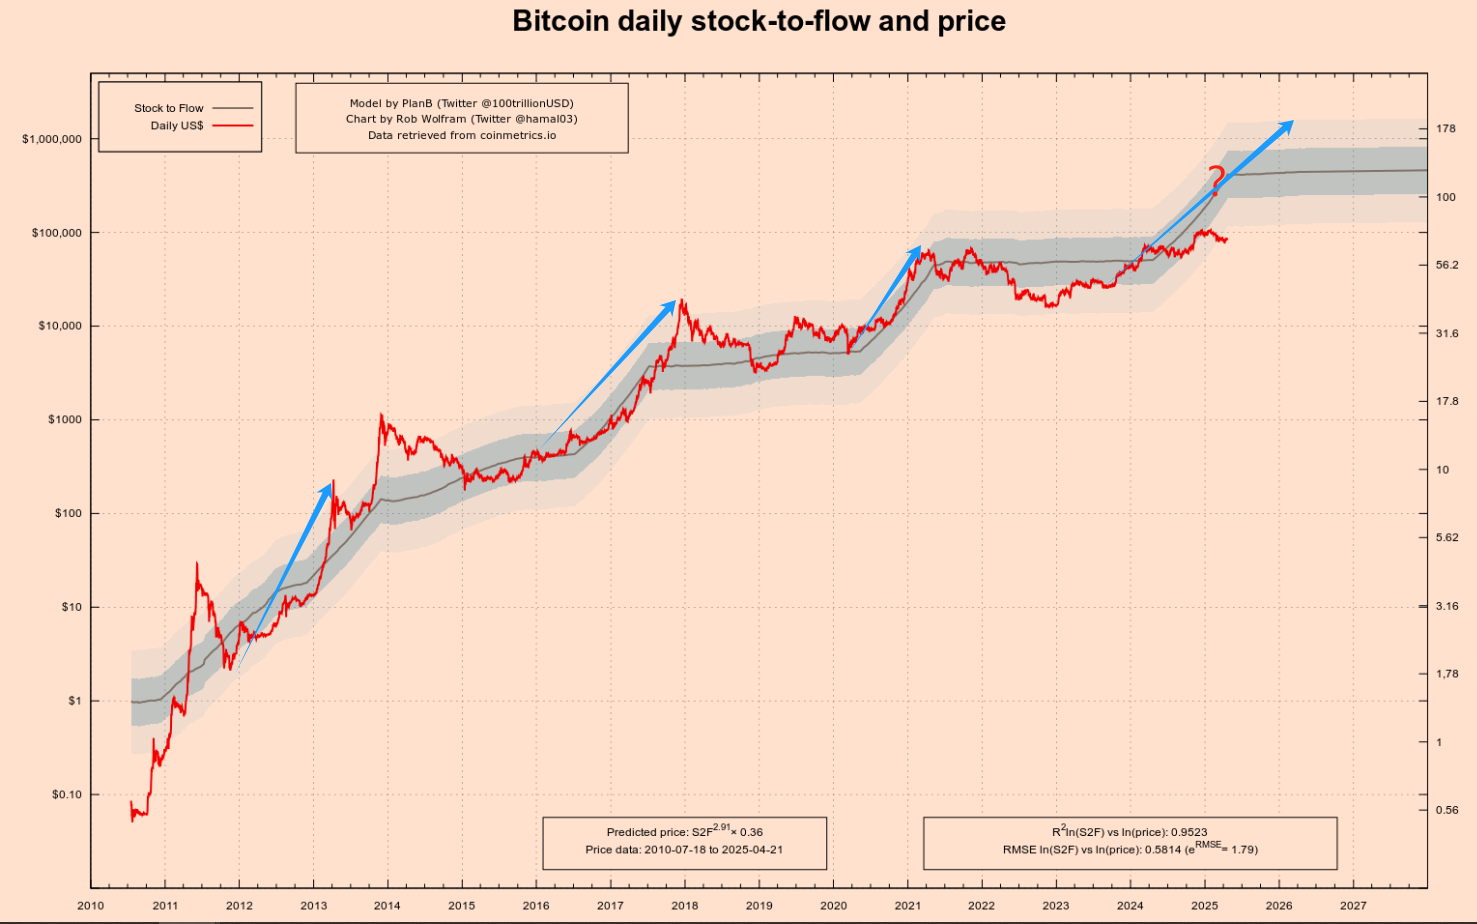
After the first halving in 2012, Bitcoin's price rose from about $12 to over $1,000 within a year.
After the second halving in 2016, the price soared from around $600 to nearly $20,000 within about 18 months.
After the third halving in 2020, the price similarly increased from around $8,000 to $69,000 within about 18 months.
You may have noticed the fourth blue arrow, which I added a big question mark to. Will the fourth halving continue the previous upward trend? My answer is yes, but the magnitude may further shrink.
You need to note that the left vertical axis of the above chart showing Bitcoin prices is on a logarithmic scale, meaning the height from 1 to 10 is the same as from 10 to 100. This helps us see Bitcoin's early trends more clearly.
Now, let me focus on this model. This model draws on valuation methods for precious metals like gold and silver. Its core logic is:
Stock: Refers to the total amount of assets currently in existence.
Flow: Refers to the annual new supply.
S2F Ratio = Stock / Flow
The higher an asset's S2F ratio, the less annual new supply there is relative to the existing stock, making the asset scarcer and theoretically increasing its value.
Gold has an extremely high S2F ratio (around 60), which is one of the important foundations for its role as a store of value. Bitcoin's S2F ratio increases with each halving. For example, after the third halving in May 2020, Bitcoin's S2F ratio rose to about 56, very close to gold's level. After the fourth halving in April 2024, its S2F ratio is expected to double, exceeding 100, making it surpass gold in terms of scarcity. See the coordinates to the right of the question mark in the above image.
One of the most popular charts in the crypto space is the Bitcoin S2F model fitting chart, as shown in the image below. It is not only known for its visual simplicity and intuitiveness but also became one of the strongest proofs of "Bitcoin's long-term price increase" due to the logic behind it.
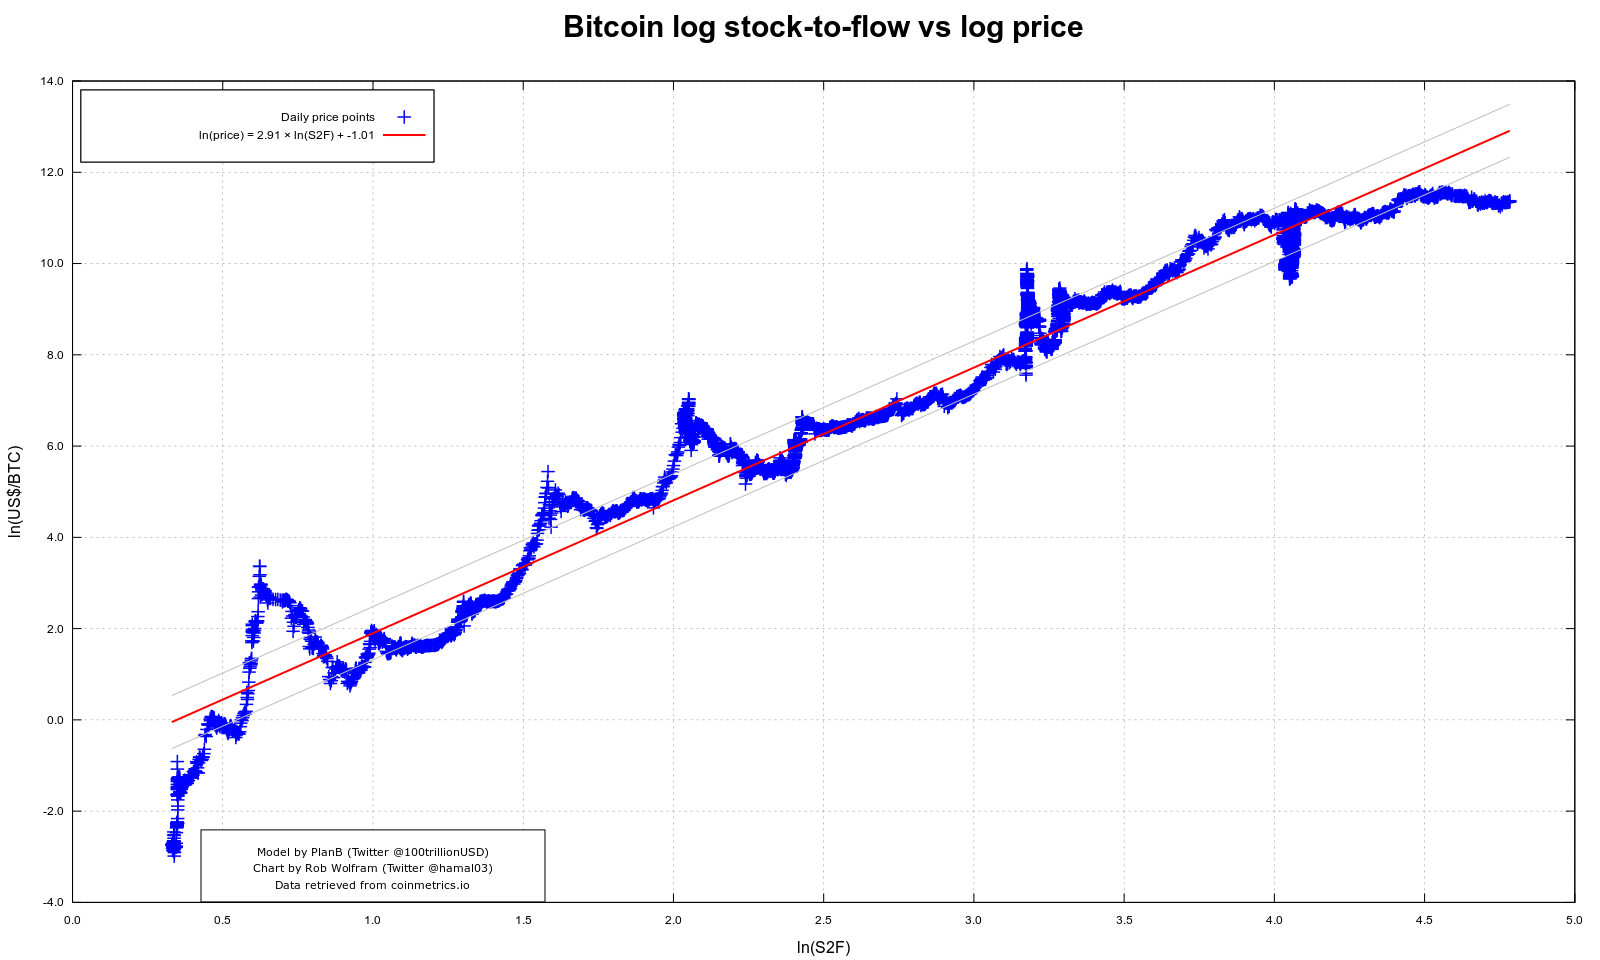
In the above chart, the horizontal axis represents the natural logarithm of S2F, and the vertical axis represents the natural logarithm of Bitcoin prices. In this log-log space, we see an almost straight red regression line that crosses all halving cycles in Bitcoin's history, showing an astonishing fit.
This chart attempts to tell everyone that whenever Bitcoin enters a new halving cycle, the new output in circulation is "halved," the S2F ratio rises, and the model's predicted long-term price also increases accordingly. This model has accurately predicted the first three halvings, but whether it will be accurate for the fourth remains unknown.
However, every model has its limitations, and S2F is no exception. It focuses entirely on the supply side: halving, capped total supply, mining speed, but completely ignores changes in demand. This may still hold when early Bitcoin users were few and demand had not yet "matured." However, after 2020, the market structure, capital volume, and institutional participation have rapidly increased, and the power to determine prices has increasingly shifted to the demand side—namely, adoption, market expectations, macro liquidity, regulatory policies, and even social media sentiment.
Clearly, a single S2F model cannot convince you or me; we also need a demand-side model.
2.2 Demand Side: Network Effects, Metcalfe’s Law
If the S2F model locks Bitcoin's "supply gate," then network effects are the "demand pump" that determines how high the water level can rise. The most intuitive measure is the on-chain activity and the expansion rate of users holding coins: by the end of 2024, non-zero balance addresses have surpassed 50 million, and in February of this year, the daily active addresses returned to approximately 910,000, refreshing a three-month high.

Using Metcalfe’s Law to roughly calculate—network value ≈ k × N²—when the number of active users doubles, the theoretical network value can expand to four times its original value. This is the underlying driving force behind Bitcoin's price repeatedly "jumping" higher over the past decade. The image above is also an AI-generated depiction of Metcalfe joyfully observing Bitcoin.
Three Key Demand Indicators
Active Addresses: Measure real usage heat over short periods;
Non-Zero Balance Addresses: Long-term penetration rate indicator; the compound growth rate over the past seven years is about 12% per year—even if the price is halved, the number of holders continues to rise.
Value Carrying Layer: The capacity of the Lightning Network channels and the number of off-chain payment transactions continue to hit new highs, providing a closed loop for "holding coins → actual payments."
This "N² driven + network stickiness" demand model has two layers of meaning:
Positive Cycle: More users → deeper transactions → richer ecosystem → increased value; this explains why every time ETFs, cross-border settlements, or emerging market payments bring in incremental users, prices experience nonlinear jumps.
Negative Cycle Risk: If faced with global regulatory crackdowns, technological replacements (such as CBDCs, Layer-2 payment variations), or macro liquidity exhaustion, activity and new users may decline simultaneously, leading to a reduction in valuation and N² together—this is a "demand gap" scenario that S2F cannot capture.
Therefore, by linking the supply-side S2F with the demand-side network effects, we can form a more complete valuation framework: when S2F points to long-term scarcity, and active addresses and non-zero balances maintain an upward slope, the mismatch between demand and supply will amplify asymmetry; conversely, if activity continues to decline, even if scarcity remains unchanged, it may trigger a simultaneous downward adjustment of price and value.
In other words, scarcity keeps Bitcoin "from depreciating," while network effects allow it to "appreciate."
It is especially worth mentioning that Bitcoin was once seen as a "geek's toy" or "a reflection of bubbles." But today, its value narrative has quietly shifted.
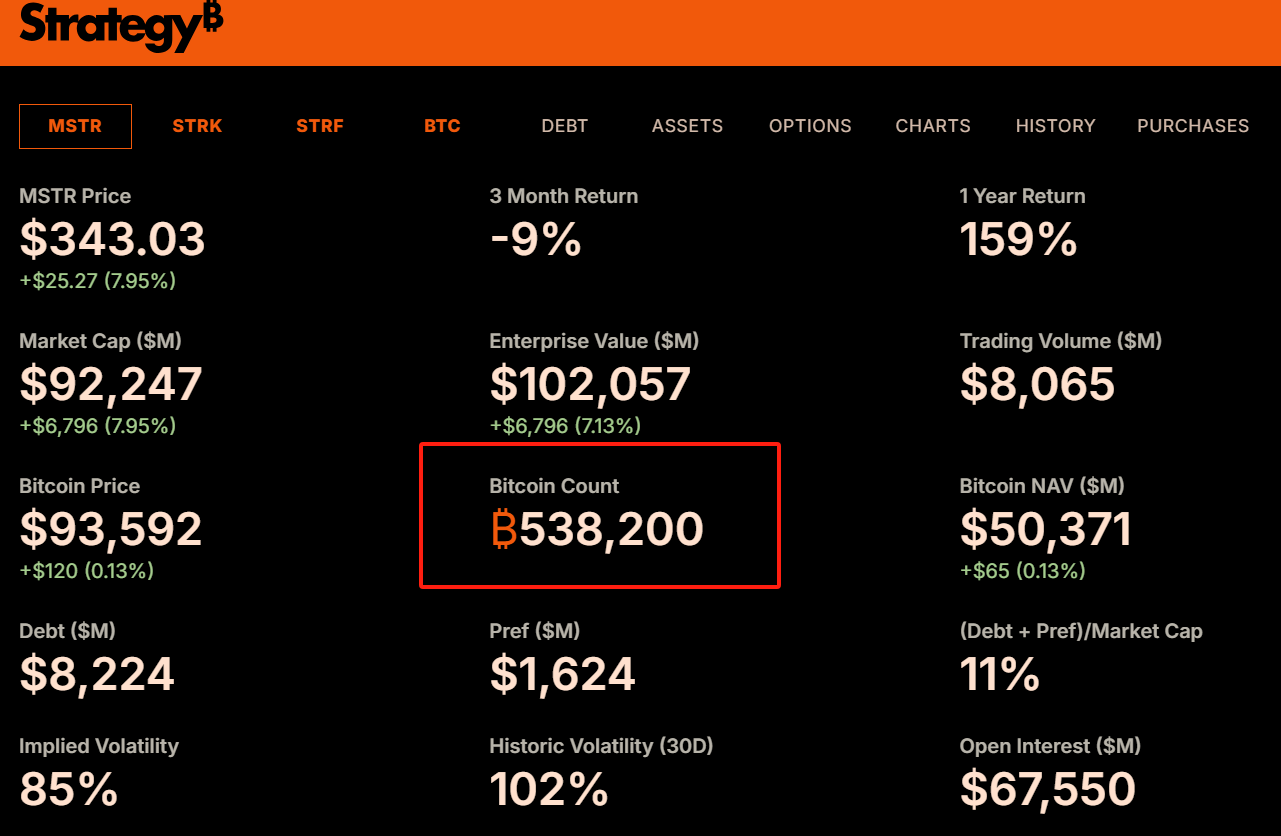
Since 2020, MicroStrategy has included Bitcoin in its corporate balance sheet, now holding 538,000 Bitcoins, as shown in the image. I previously provided a detailed introduction to Strategy's transformation in the article "The Bitcoin Dividend."
Subsequently, top global asset management firms like BlackRock and Fidelity have also launched Bitcoin spot ETFs, bringing in billions of dollars in incremental funds. Morgan Stanley and Goldman Sachs have begun offering BTC investment services to high-net-worth clients, and even countries like El Salvador have adopted it as legal tender. These changes are not only a capital-level embrace but also a backing of "legitimacy" and "institutional consensus."
2.3 Summary
In the world of Bitcoin valuation, supply and demand are never isolated variables; they form a "double helix" of asymmetric opportunities.
On one hand, the S2F model starts from programmatic deflation, using mathematical formulas to depict the lifting power of scarcity on long-term prices;
On the other hand, network effects rely on on-chain data and user growth to demonstrate the real demand foundation for Bitcoin as a "digital network."
In this structure, the mismatch between price and value becomes increasingly clear—this is precisely the moment that value investors look forward to: when sentiment is low, and prices are below what comprehensive valuation models indicate, the window of asymmetric opportunity quietly opens. This also leads us to the question we truly need to discuss: Is the essence of value investing to seek out these asymmetric opportunities that are undervalued by emotion and corrected by time?
3. The Essence of Value Investing is to Seek Asymmetry?
The core of value investing has never been merely about "buying cheap things," but is built on a more fundamental logical foundation: finding an asymmetric structure with limited risk and potentially huge returns in the misalignment between price and value.
This is the essential difference between value investing and trend investing, momentum trading, and technical speculation.
Trend investing relies on market inertia, speculative trading bets on short-term fluctuations, while value investing involves calmly assessing the long-term value of an asset at times when market sentiment is extremely detached from rational judgment, and decisively buying when prices are significantly below that value, waiting for the market to return to rationality. This approach works precisely because it establishes a natural asymmetric structure: the worst outcome you face is a controllable loss, while the best outcome you achieve often far exceeds expectations.
If we closely examine the logic of value investing, we find that it is not a specific operational method but a structural thinking based on probability and imbalance.
Investors analyze "margin of safety" to assess the downside potential in the worst-case scenario;
They study "intrinsic value" to clarify the possibility and space for target price recovery;
And they "patiently hold" because the returns from asymmetric structures often require time to materialize.
All of this is not about pursuing perfect predictive ability but about constructing a "betting structure" amid a series of uncertainties—when you judge correctly, the gains far outweigh the losses when you judge incorrectly, which is the essence of asymmetric investing.
Many people misunderstand value investing as conservative, sluggish, and low volatility; in fact, it is quite the opposite. True value investing does not mean "low returns, low risk"; it means exchanging controllable risks for highly asymmetric return potential. Whether it is early Amazon investors or long-term holders of Bitcoin quietly buying during a bear market, they are essentially doing the same thing: when most people underestimate the future of an asset, and the price is pushed to extreme ranges due to emotion, policy, or misunderstanding, they are quietly positioning themselves.
From this perspective:
Value investing is not an ancient strategy of "buying cheap and collecting dividends," but a common language for all investors truly pursuing asymmetric return structures.
It emphasizes not only cognitive ability but also emotional control, risk awareness, and faith in time. It does not require you to be smarter than others; it only requires you to remain calm when others are frantic and to dare to bet when others flee.
Therefore, understanding the deep relationship between value investing and asymmetry also clarifies why Bitcoin, despite its different form from traditional assets, can be embraced by serious value investing methods. Its volatility is not an enemy but a gift; its panic is not a risk but a pricing error; its asymmetry is a rare opportunity for asset revaluation in this era. And true value investors are waiting for the next such opportunity, quietly positioning themselves in the depths of calm waters.
4. How to Invest in Bitcoin Using Asymmetry?
Having understood the sources of Bitcoin's intrinsic value and recognized that market fluctuations create opportunities where prices fall below value, the next question is: as ordinary investors, how can we practice value investing in Bitcoin?
It is important to emphasize that value investing does not pursue "bottom fishing," which attempts to buy at the lowest price point; this is an extremely difficult, if not impossible, task. The core of value investing lies in starting to buy in batches and with discipline when the price enters your judgment of an obviously undervalued "value zone," and patiently holding while waiting for the return and growth of value.
For a highly volatile asset like Bitcoin, here are some simple and practical value investing strategies:
4.1 Dollar-Cost Averaging (DCA)
This is the most basic and suitable strategy for most people. DCA refers to investing a fixed amount of money to purchase Bitcoin at regular time intervals (e.g., weekly, monthly), regardless of whether the current price is high or low.
Advantages:
Cost Averaging: Buying fewer amounts at high prices and more at low prices will lower your average holding cost over the long term, below the market average during a sustained upward process.
Overcoming Emotion: DCA is a disciplined investment method that helps you avoid the impulse to chase prices due to short-term market fluctuations. You only need to execute according to plan without worrying about subjective judgments and timing.
Simple and Easy: It does not require complex analysis or frequent operations, making it suitable for investors who do not have much time or energy to study the market.
Regarding DCA, I have previously elaborated in detail in "Bitcoin: The Ultimate Hedge for Long-Termists." If you have any questions, I suggest you take a serious look at it.
4.2 Dynamic Adjustments Based on Market Sentiment Indicators: Fear & Greed Index
Building on DCA, if you wish to slightly improve investment efficiency, you can introduce market sentiment indicators as auxiliary judgments. Among them, the "Crypto Fear & Greed Index" is a widely followed indicator.
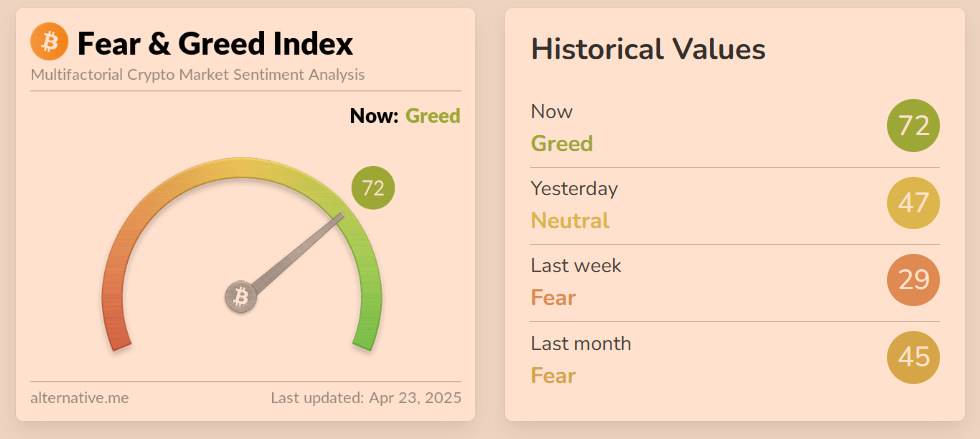
This index combines multiple factors such as market volatility, trading volume, social media sentiment, market dominance, and survey data to measure the overall sentiment of the current market with a value from 0 to 100:
0-25: Extreme Fear
25-45: Fear
45-55: Neutral
55-75: Greed
75-100: Extreme Greed
The contrarian thinking of value investing tells us, "Be greedy when others are fearful, and be fearful when others are greedy." Therefore, we can incorporate the Fear & Greed Index into the DCA strategy:
Basic Investment: Maintain the regular investment plan unchanged every month/week.
Add During Fear: When the index enters the "Extreme Fear" range (e.g., below 20 or 15), it indicates that market sentiment is extremely pessimistic, and prices may be severely undervalued. At this time, you can make an additional investment beyond your regular contributions.
Caution/Reduce During Greed (Optional): When the index enters the "Extreme Greed" range (e.g., above 80 or 85), it indicates that market sentiment is overheated and risks are accumulating. At this time, you can choose to pause regular investments or even consider selling part of your profits in batches to lock in gains.
4.3 Important Reminder
Never invest more than you can afford to lose. Bitcoin remains a high-risk asset, and its price could go to zero (although the likelihood of this decreases as it develops, the theoretical risk always exists). Allocate your assets reasonably; the proportion of Bitcoin in your total investment portfolio should match your risk tolerance. However, Bitcoin is also the least risky cryptocurrency, so it should dominate your entire crypto asset allocation. My asset allocation is—Bitcoin: Ethereum: Others = 5:3:2.
Using DCA or a dynamic DCA strategy combined with sentiment indicators essentially practices the core principles of value investing: acknowledging that you cannot predict the market, utilizing the irrational fluctuations of the market, and accumulating assets in areas where prices may be below intrinsic value in a disciplined manner. Remember: investing should not become the most important thing in your life; you should not lose sleep over it.
Conclusion
Bitcoin is not a gambling table for you to escape reality; it is a footnote for you to re-understand reality.
In this uncertain world, we often mistakenly believe that safety is stability, risk aversion, and staying away from volatility. But true safety has never been about avoiding risk; it is about understanding risk, mastering risk—and being able to see the value cornerstone buried beneath the sand when everyone else turns to flee.
This is the true essence of value investing: seeking the asymmetric structures forged by cognition amid emotional misalignment; quietly buying those forgotten by the market at the deepest troughs of cycles, which will ultimately return to their rightful place.
And Bitcoin, as a financial species that has scarcity written into its algorithm, evolves value within its network, and repeatedly resurrects in panic, is the purest manifestation of this asymmetry. Its price may never be calm; but its logic remains consistent: scarcity is the lower limit, the network is the upper limit, volatility is opportunity, and time is leverage.
You may never accurately bottom Bitcoin, but you can traverse one cycle after another, continuously buying misunderstood value at reasonable prices. Not because you have magical judgment, but because you possess a higher-order way of thinking—you believe: the best bet is to place your chips on the side of time when others turn to leave.
So remember this phrase:
Those who bet in the depths of irrationality are often the most rational; and time is the most faithful deliverer of asymmetry.
This game will always belong to those who understand the order behind volatility and see the logic behind collapse. Because they know: the world does not reward emotion; the world rewards cognition. And cognition will ultimately be proven by time.
免责声明:本文章仅代表作者个人观点,不代表本平台的立场和观点。本文章仅供信息分享,不构成对任何人的任何投资建议。用户与作者之间的任何争议,与本平台无关。如网页中刊载的文章或图片涉及侵权,请提供相关的权利证明和身份证明发送邮件到support@aicoin.com,本平台相关工作人员将会进行核查。


